Fig. 6
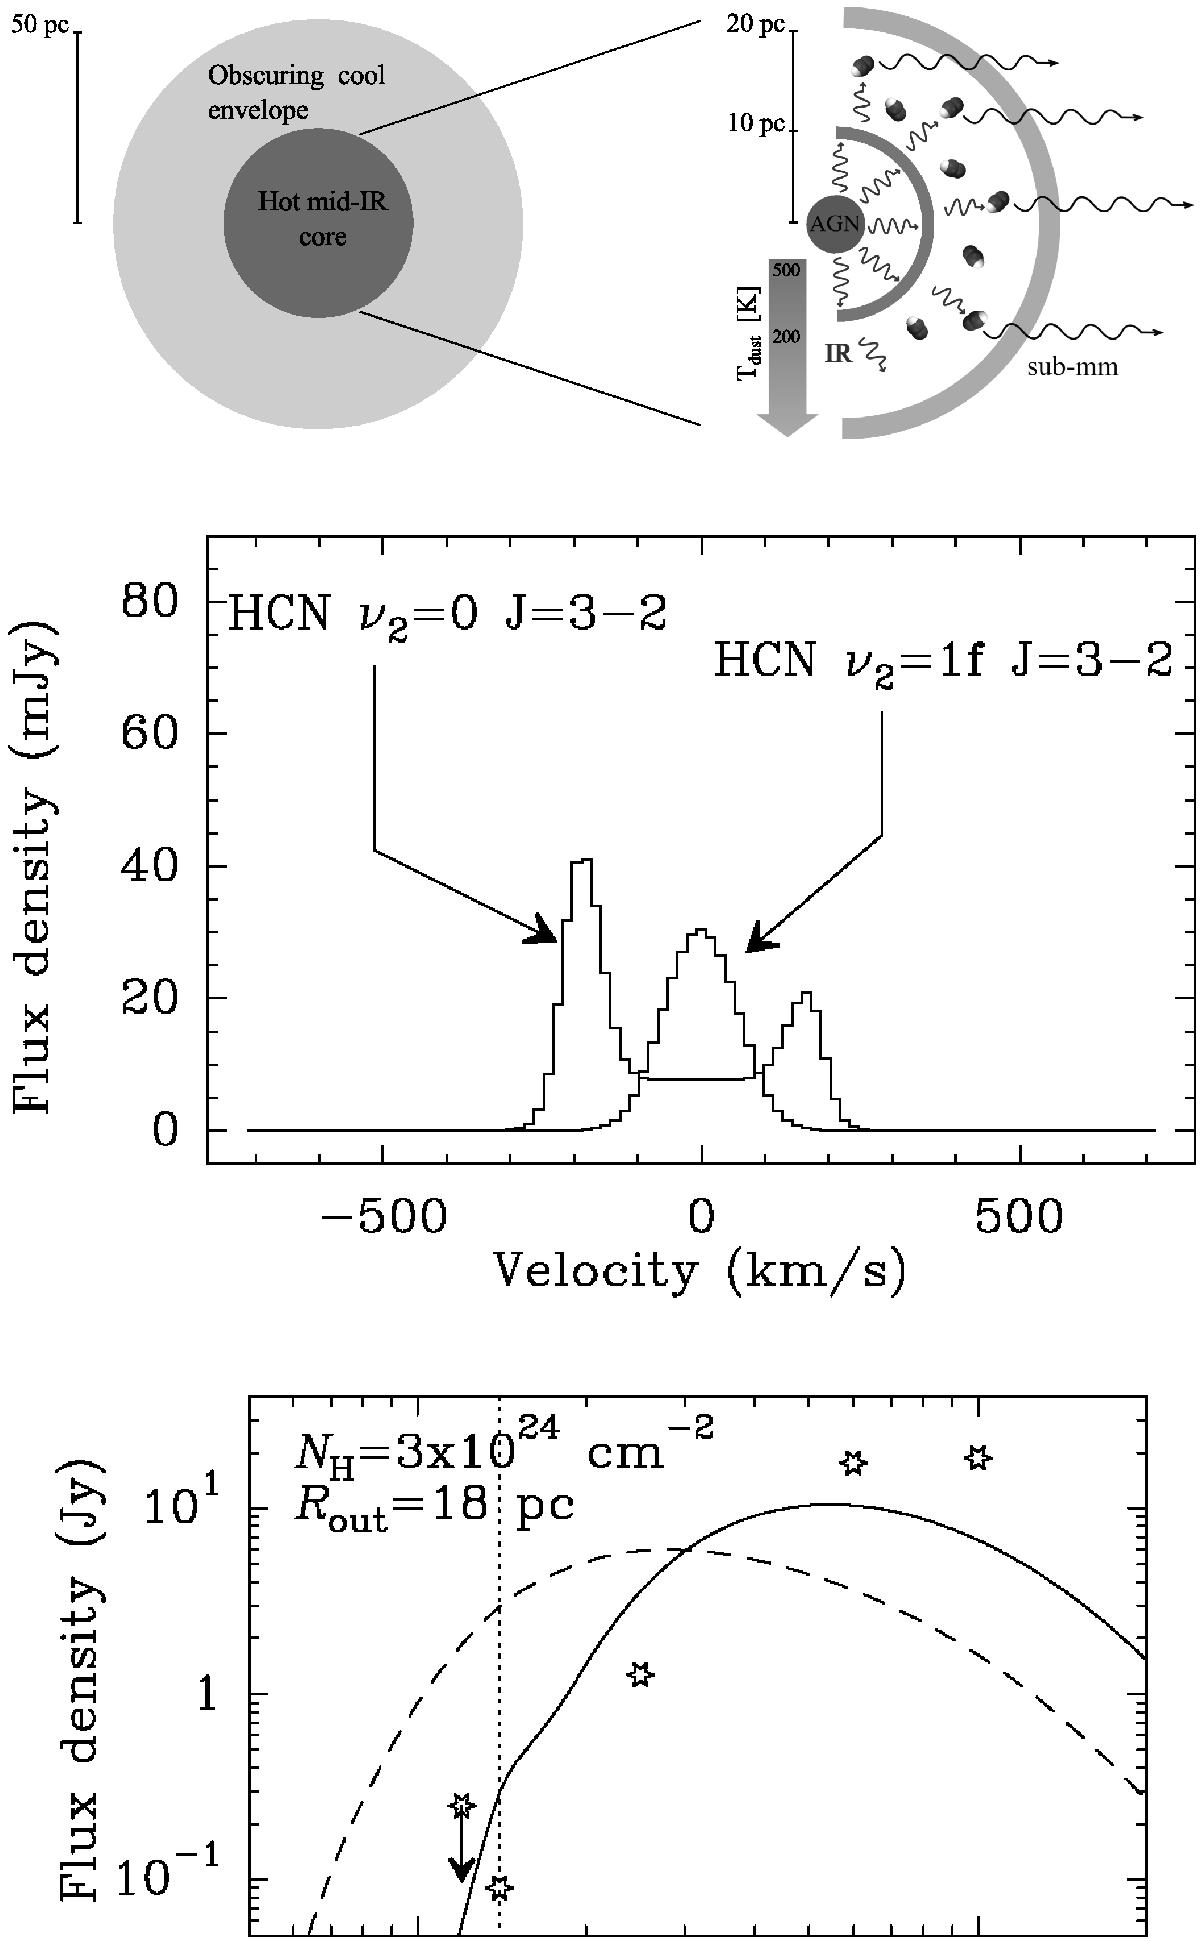
Upper panel: illustration of the vibrationally excited (HCN-VIB) line emission emerging from a buried mid-IR core -surrounded by cooler material giving rise to the self-absorption feature in the HCN line. An embedded AGN nucleus would be one possible scenario that is powering the bright HCN-VIB and causing the temperature gradient with the resulting self-absorbed HCN and HCO+ lines. Middle panel: illustration of a possible scenario that may account for the observed HCN and HCN-VIB emission in IC 860 with a buried compact heating source, where the assymmetric HCN spectrum is caused by an inflow of gas. The model was generated with the tool described in González-Alfonso & Cernicharo (1999), which includes line overlaps (Gonzalez-Alfonso & Cernicharo 1997). Note that these examples assume a spherical geometry while our results may imply a more torus- or disk-like morphology. Lower panel: this is an illustration of how the dust spectral energy distribution (SED) for IC 860 is shifted from shorter to longer wavelengths by the absorption of the emission from the hot buried source. The dashed curve is the intrinsic unobscured SED and the stars and the solid line indicate the observed flux and the fitted SED.
Current usage metrics show cumulative count of Article Views (full-text article views including HTML views, PDF and ePub downloads, according to the available data) and Abstracts Views on Vision4Press platform.
Data correspond to usage on the plateform after 2015. The current usage metrics is available 48-96 hours after online publication and is updated daily on week days.
Initial download of the metrics may take a while.