Fig. 4
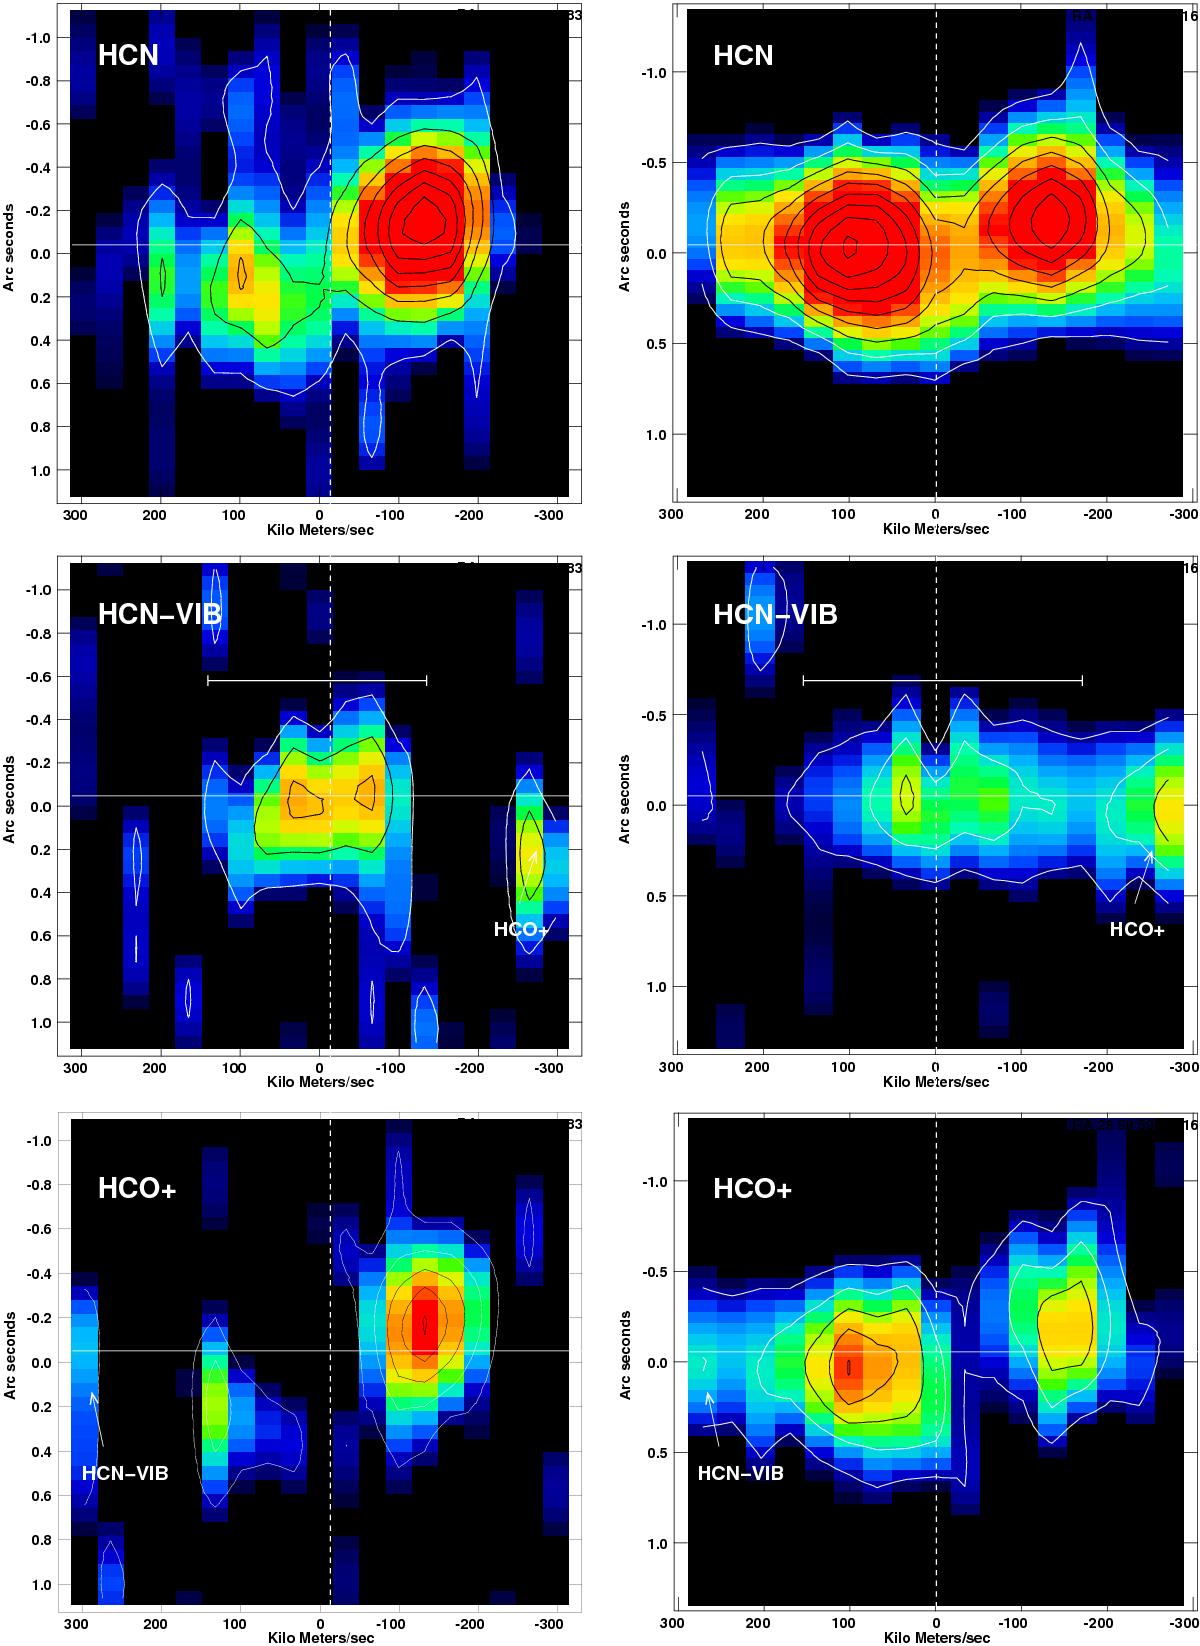
Position velocity (pV) diagrams (continuum subtracted) for IC 860 (left) and Zw049.057 (right) where the x-axis shows the radial velocity (relative to cz = 3880km s-1 and 3900 km s-1 respectively) and the y-axis shows the position along the major axis (for both galaxies the position angle is –20°). The upper panel shows the HCN, the centre the HCN-VIB and the lower panel the HCO+ pV diagrams. The contours are 3.5 × (1,3,5,7,9,11,13) mJy beam-1 (IC 860) and 3.5 × (1, 3, 5, ... 17) mJy beam-1 (for Zw049.057). The colour ranges from 2 to 30 mJy beam-1. The white vertical dashed line indicate the systemic velocity. The horizontal white line indicates the nuclear position of the HCN-VIB line.
Current usage metrics show cumulative count of Article Views (full-text article views including HTML views, PDF and ePub downloads, according to the available data) and Abstracts Views on Vision4Press platform.
Data correspond to usage on the plateform after 2015. The current usage metrics is available 48-96 hours after online publication and is updated daily on week days.
Initial download of the metrics may take a while.