Fig. 2
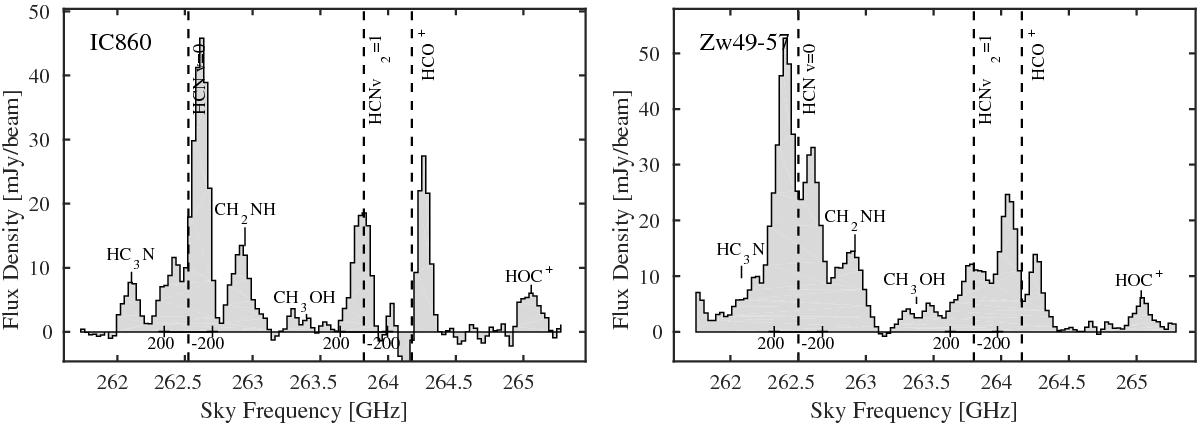
IRAM Plateau de Bure spectra (continuum subtracted) of IC 860 (left panel) and Zw049.057 (right panel). The systemic velocities of HCN, HCO+ and HCN-VIB J = 3–2 are marked with dashed vertical lines. The self- and continuum absorption leads to double-peaked HCN and HCO+ν = 0 spectra while the HCN-VIB lines are singled peaked close to systemic velocity (see Sect. 4.2). The spectra also show prominent, single peaked lines of HOC+, CH2NH, CH3OH and HC3N. Fluxes are in mJy beam-1.
Current usage metrics show cumulative count of Article Views (full-text article views including HTML views, PDF and ePub downloads, according to the available data) and Abstracts Views on Vision4Press platform.
Data correspond to usage on the plateform after 2015. The current usage metrics is available 48-96 hours after online publication and is updated daily on week days.
Initial download of the metrics may take a while.