Fig. 1
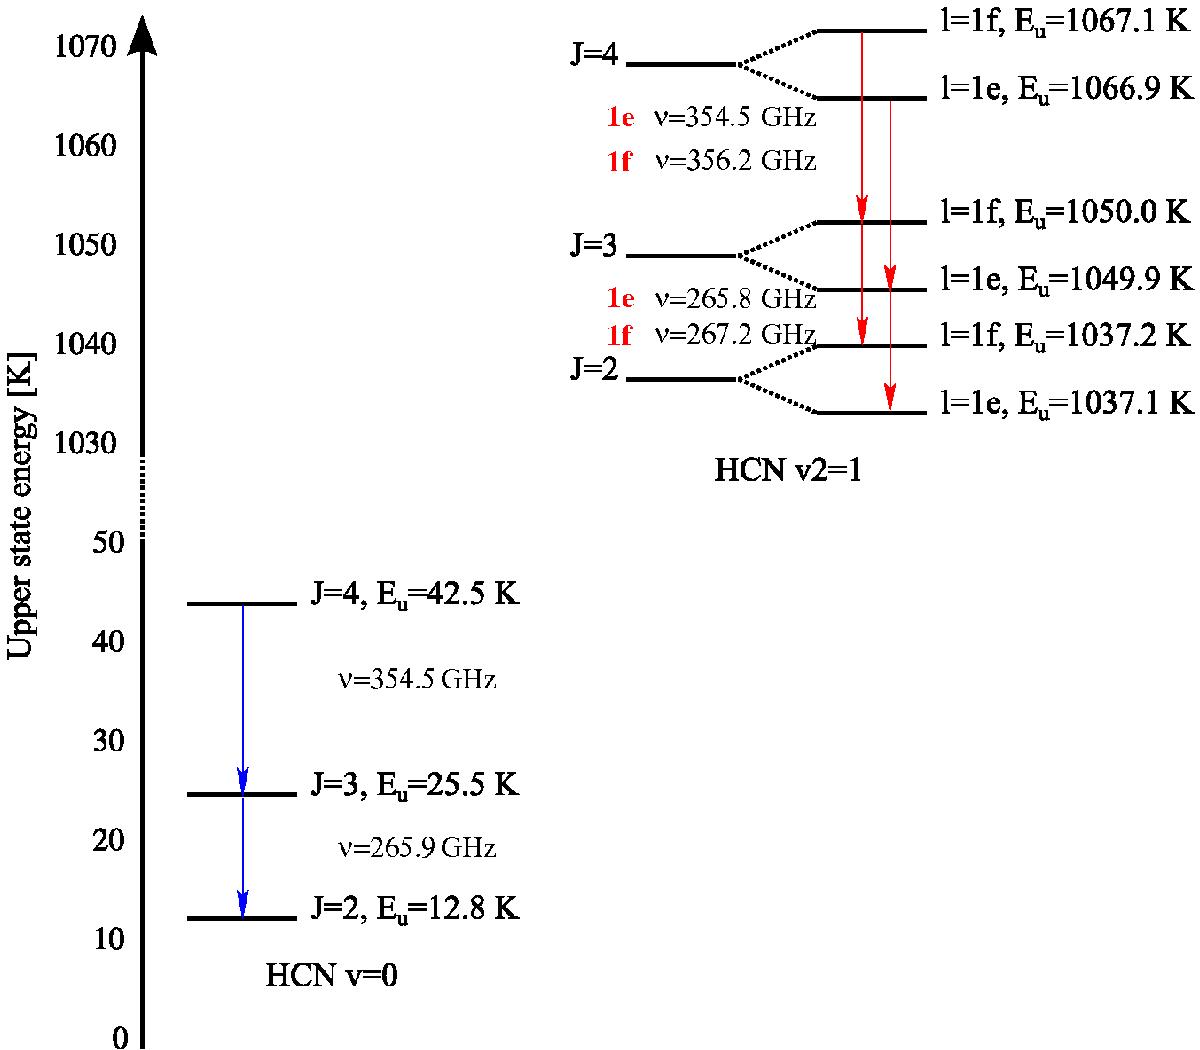
HCN energy diagram with the HCN ν = 0 and ν2 = 1J = 4, 3, 2 levels marked. The split of the ν2 = 1 rotational levels into e and f is also shown. The energy levels are not to scale which is illustrated by the dashed y-axis. The transitions are indicated with arrows. The values for the energy levels are from the Cologne Database for Molecule Spectroscopy (CDMS)1.
Current usage metrics show cumulative count of Article Views (full-text article views including HTML views, PDF and ePub downloads, according to the available data) and Abstracts Views on Vision4Press platform.
Data correspond to usage on the plateform after 2015. The current usage metrics is available 48-96 hours after online publication and is updated daily on week days.
Initial download of the metrics may take a while.