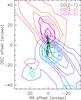
Fig. A.1
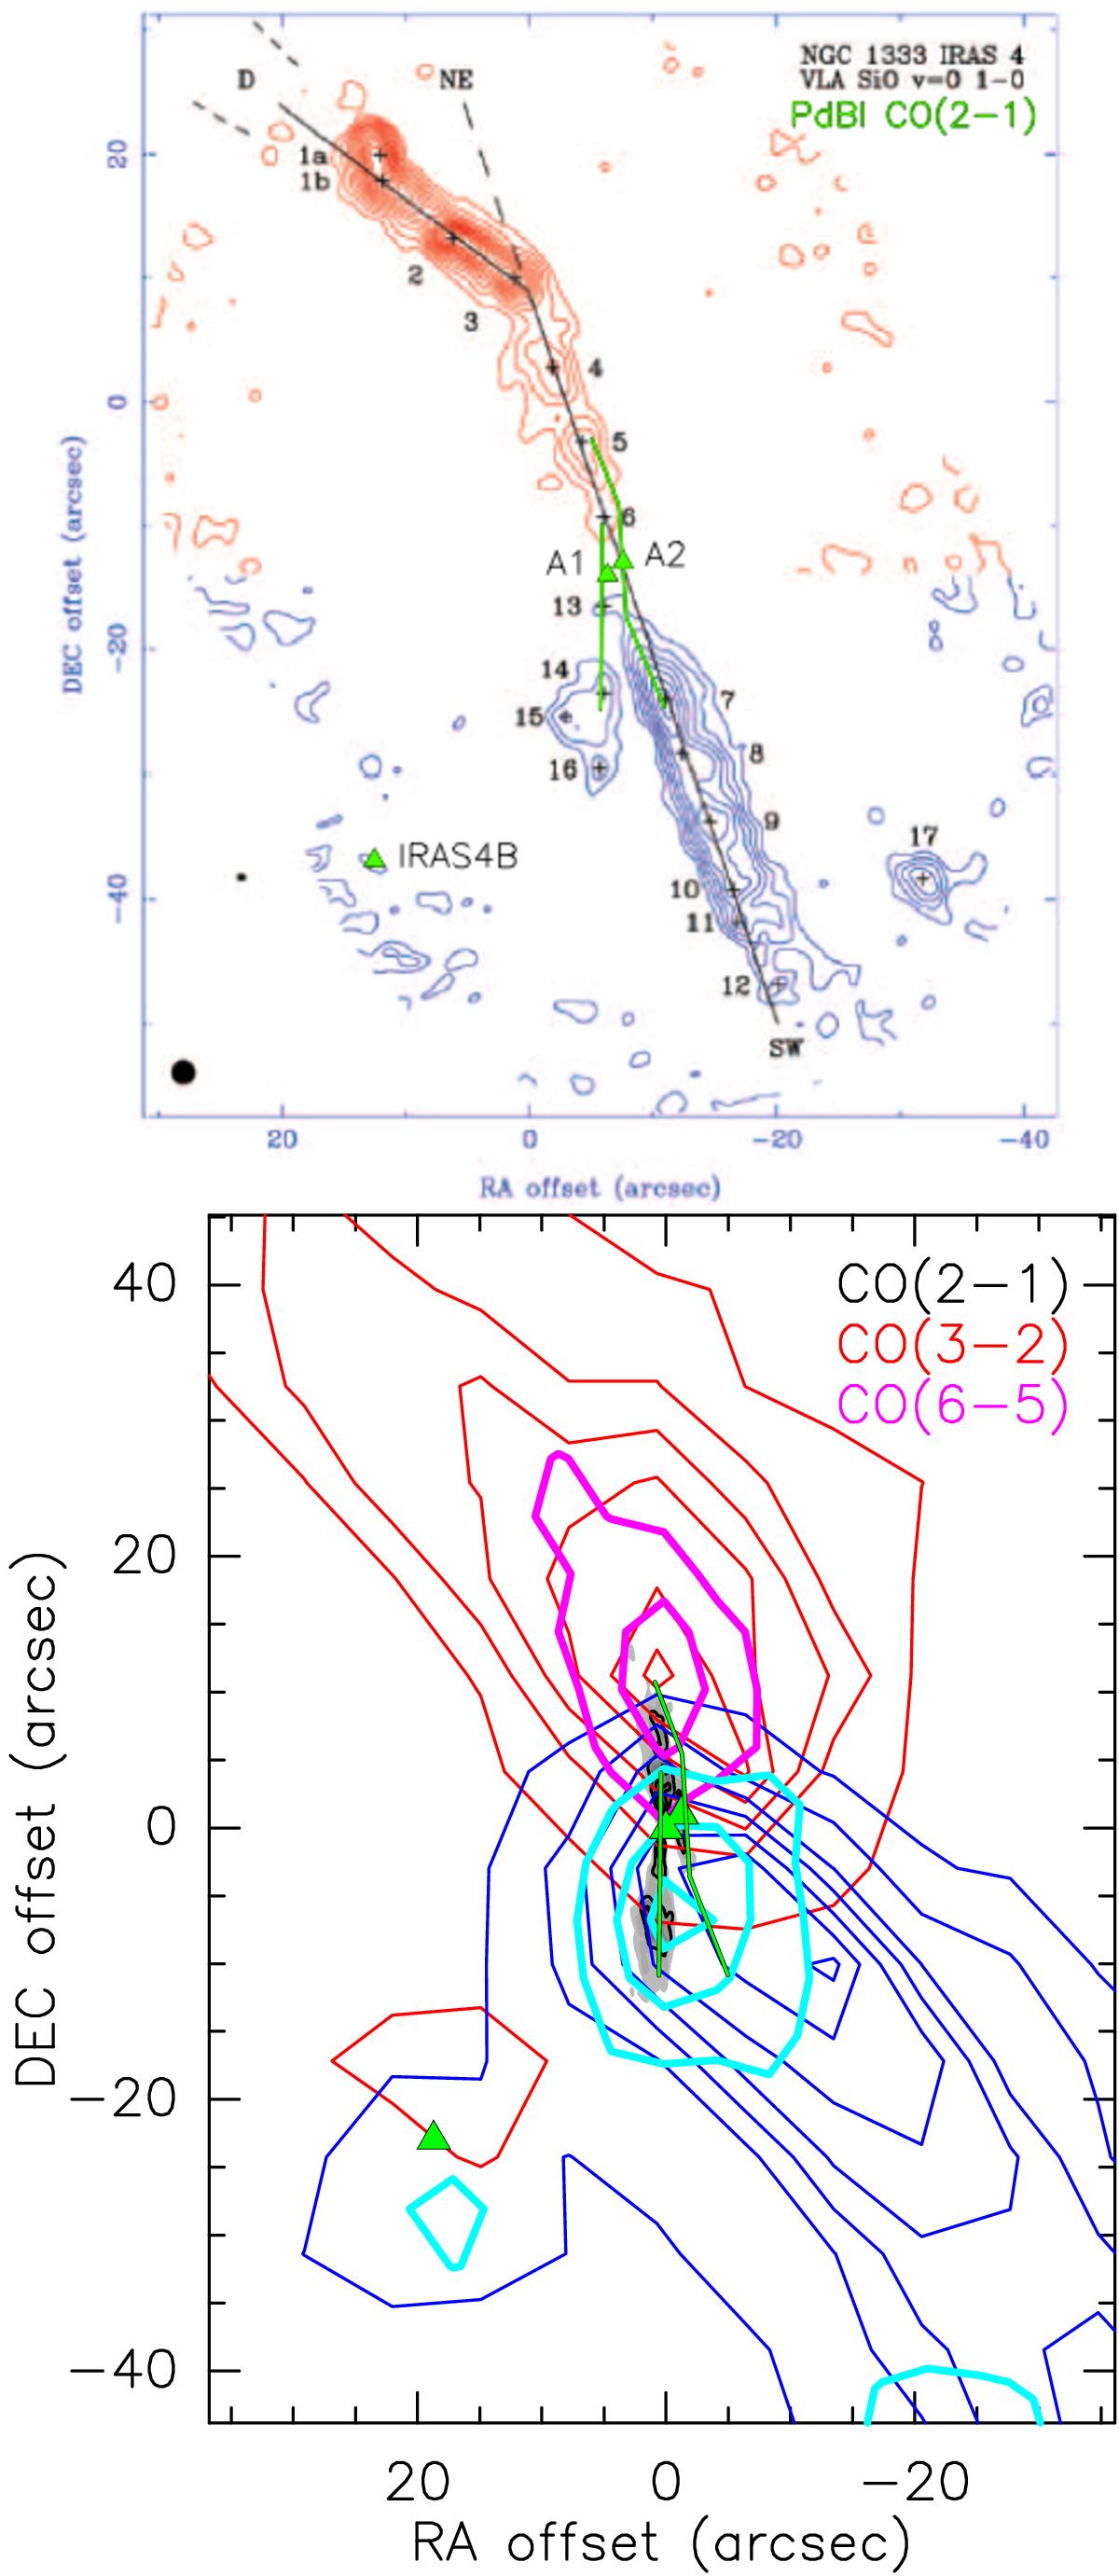
Upper: the VLA SiO(1−0) map (red and blue contours) by Choi (2005) is shown in comparison with the proposed propagation directions of the A1 and A2 jets (green solid lines, see Fig. 5). The positions of IRAS4A1 and A2 (this work) and of IRAS4B (Looney et al. 2000) are marked with green triangles. Lower: the PdBI CO(2−1) map (grey scale and black contours) integrated over the whole velocity range of emission (−20, +55 km s-1) is compared with the JCMT CO(3−2) (red and blue contours) and APEX CO(6−5) (magenta and cyan contours) maps from Yıldız et al. (2012). CO(2−1) emission is only shown within the PdBI field of view of 20′′ at 230 GHz. The CO(3−2) and CO(6−5) maps are integrated in the velocity ranges between −20 km s-1 and 3 km s-1 for the blue-shifted emission and 12 km s-1 and 50 km s-1 for the red-shifted emission. The contour levels start at the 3σ level and increase in steps of 3σ for the CO(2−1) emission, from the 5σ level emission in steps of 10σ for the CO(3−2), and from the 5σ level emission in steps of 5σ for the CO(6−5).
Current usage metrics show cumulative count of Article Views (full-text article views including HTML views, PDF and ePub downloads, according to the available data) and Abstracts Views on Vision4Press platform.
Data correspond to usage on the plateform after 2015. The current usage metrics is available 48-96 hours after online publication and is updated daily on week days.
Initial download of the metrics may take a while.