Fig. 5
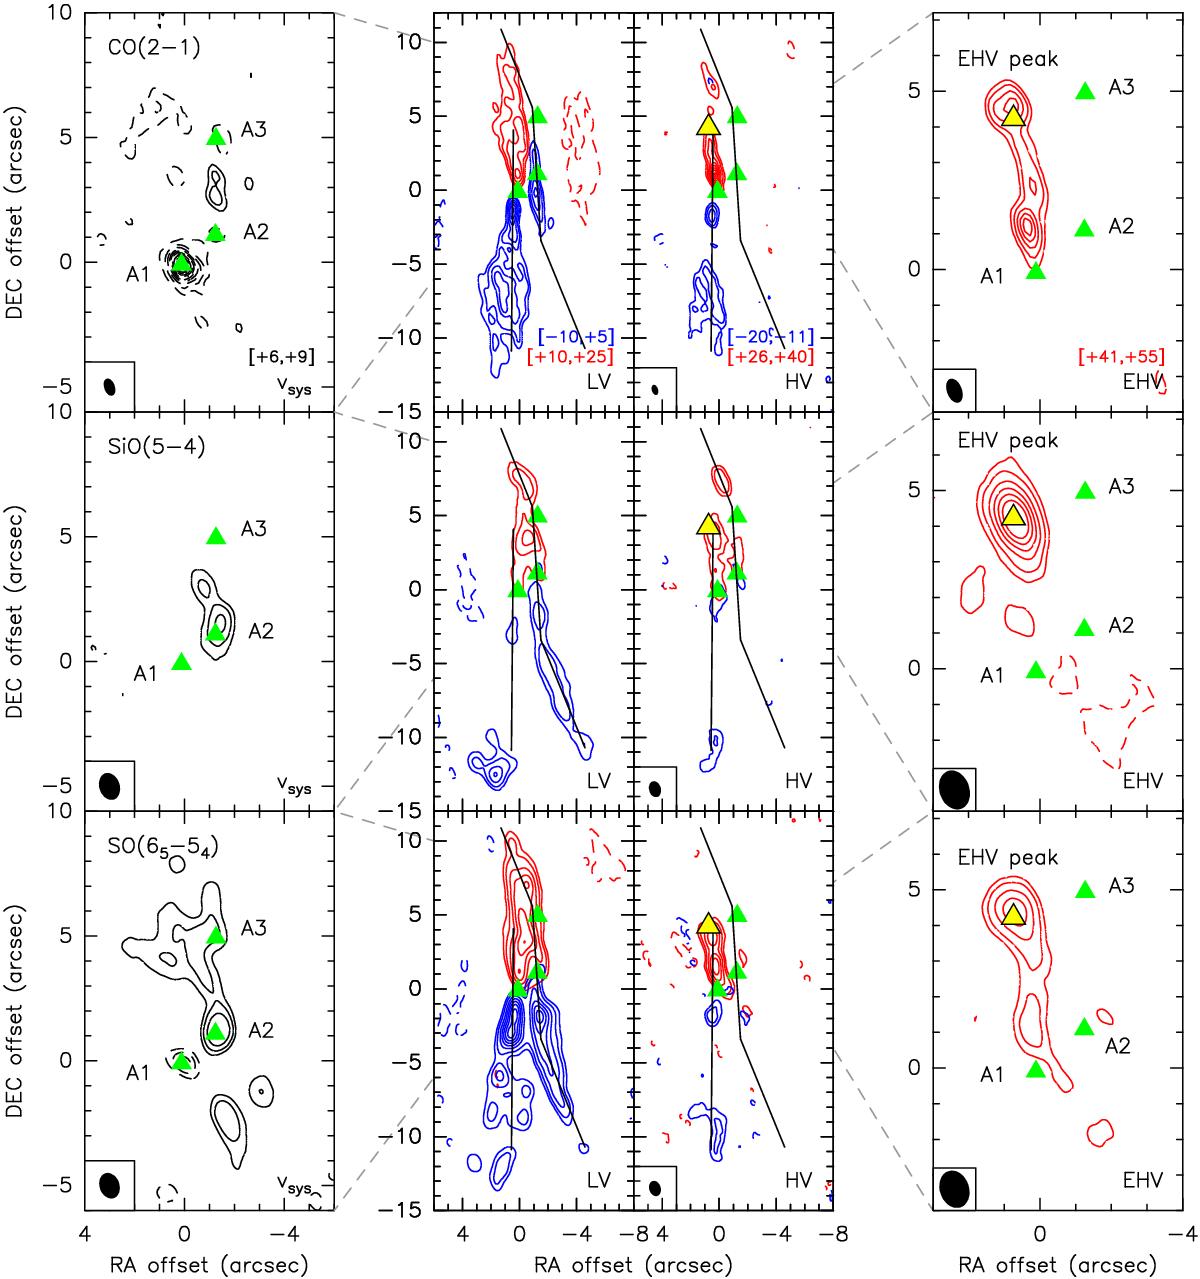
Upper: channel maps of the 12CO(2−1) emission integrated in the ambient systemic- (vsys; +6, +9 km s-1), low- (LV; −10, +5 km s-1 and +10, +25 km s-1), high- (HV; −20, −11 km s-1 and +26, +40 km s-1), and extremely high- (EHV, +41, +55 km s-1) velocity ranges. The contour levels of emission are traced at 5 and 8σ levels and increase in steps of 5σ. Negative emission is shown with dashed contours starting at the 3σ level and decreasing in steps of 3σ. The positions of the continuum sources at 1.3 mm are marked in green and the position of the SiO(5−4) emission peak in the EHV range is marked in yellow. The PdBI synthesised beams (HPBW) are shown in the bottom-left corner. Solid black curves indicate the proposed propagation directions of the A1 and A2 jets. Middle: same as the upper panel for the SiO(5−4) emission. Lower: same as the upper panel for the SO(65−54) emission.
Current usage metrics show cumulative count of Article Views (full-text article views including HTML views, PDF and ePub downloads, according to the available data) and Abstracts Views on Vision4Press platform.
Data correspond to usage on the plateform after 2015. The current usage metrics is available 48-96 hours after online publication and is updated daily on week days.
Initial download of the metrics may take a while.