Fig. 5
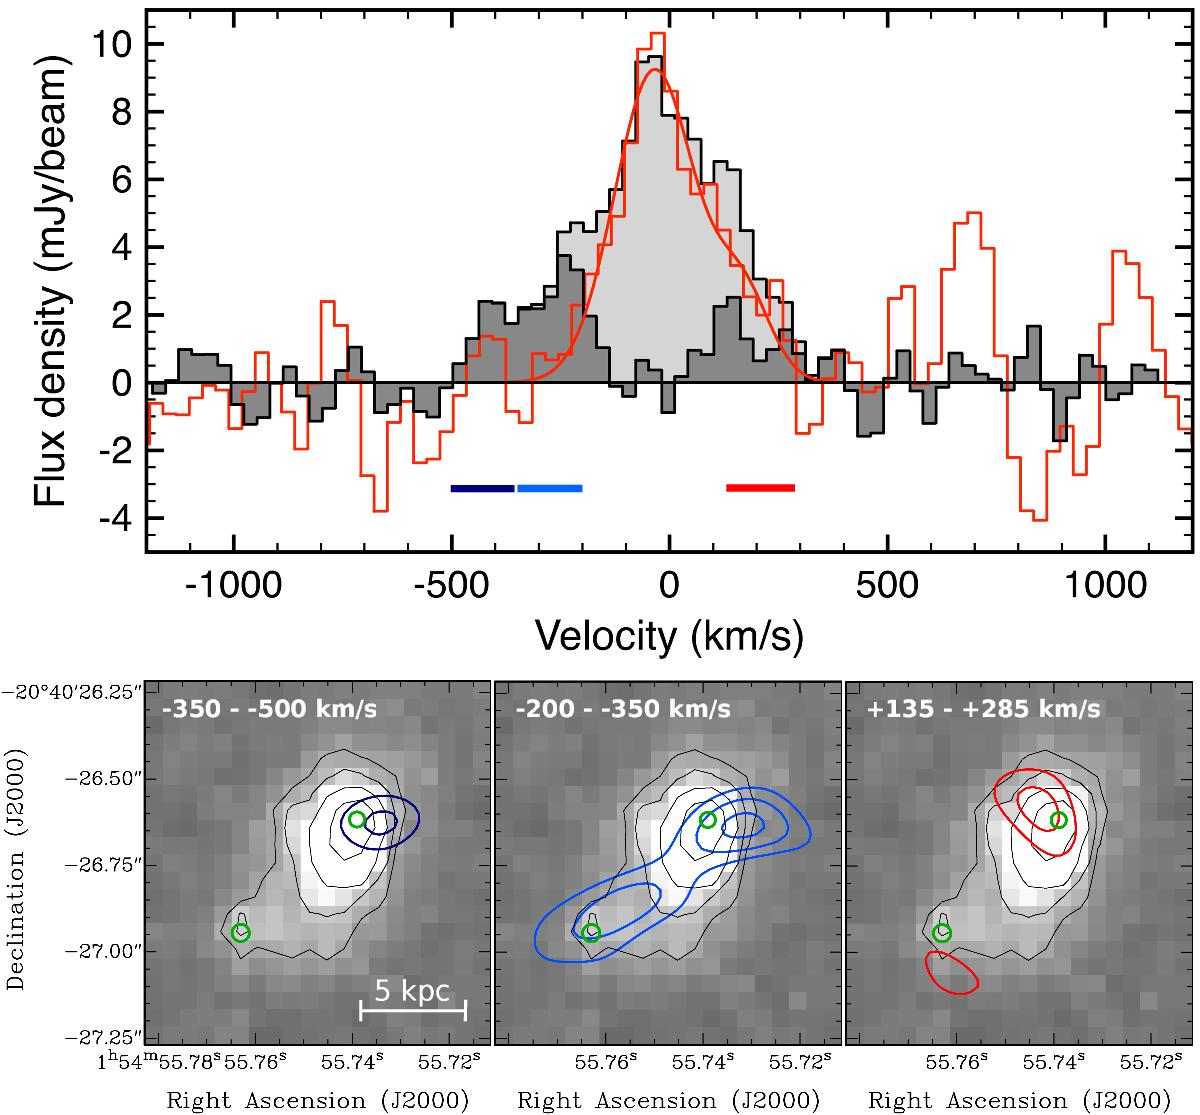
Top: combined CO(6−5) spectrum of NW + SE, extracted from data smoothed to the resolution of the CO(1−0) data. The red spectrum is the CO(1−0) emission from the same region, scaled up by a factor of 13. The red line is the model fit to the CO(1−0) spectrum (see EM15). The dark-grey area reveals the “high-excitation” residuals when subtracting the CO(1−0) model from the CO(6−5) profile. Bottom: total intensity plots of the velocity ranges where the blue and red wing dominate the CO(6−5) flux, as indicated by the dark-blue, blue and red bars. Contour levels: 2.8, 3.8, 4.8 σ, with σ = 0.064 Jy beam-1 × km s-1. The grey-scale image and thin black/white contours show the HST/WFPC2 image from EM15. The green circles show the location of the CO(6−5) peak emission from the total intensity image of Fig. 2, derived by fitting a point-source model to the NW and SE component in the image plane (the size of the circles represents the positional uncertainty of this model-fit).
Current usage metrics show cumulative count of Article Views (full-text article views including HTML views, PDF and ePub downloads, according to the available data) and Abstracts Views on Vision4Press platform.
Data correspond to usage on the plateform after 2015. The current usage metrics is available 48-96 hours after online publication and is updated daily on week days.
Initial download of the metrics may take a while.