Fig. 4
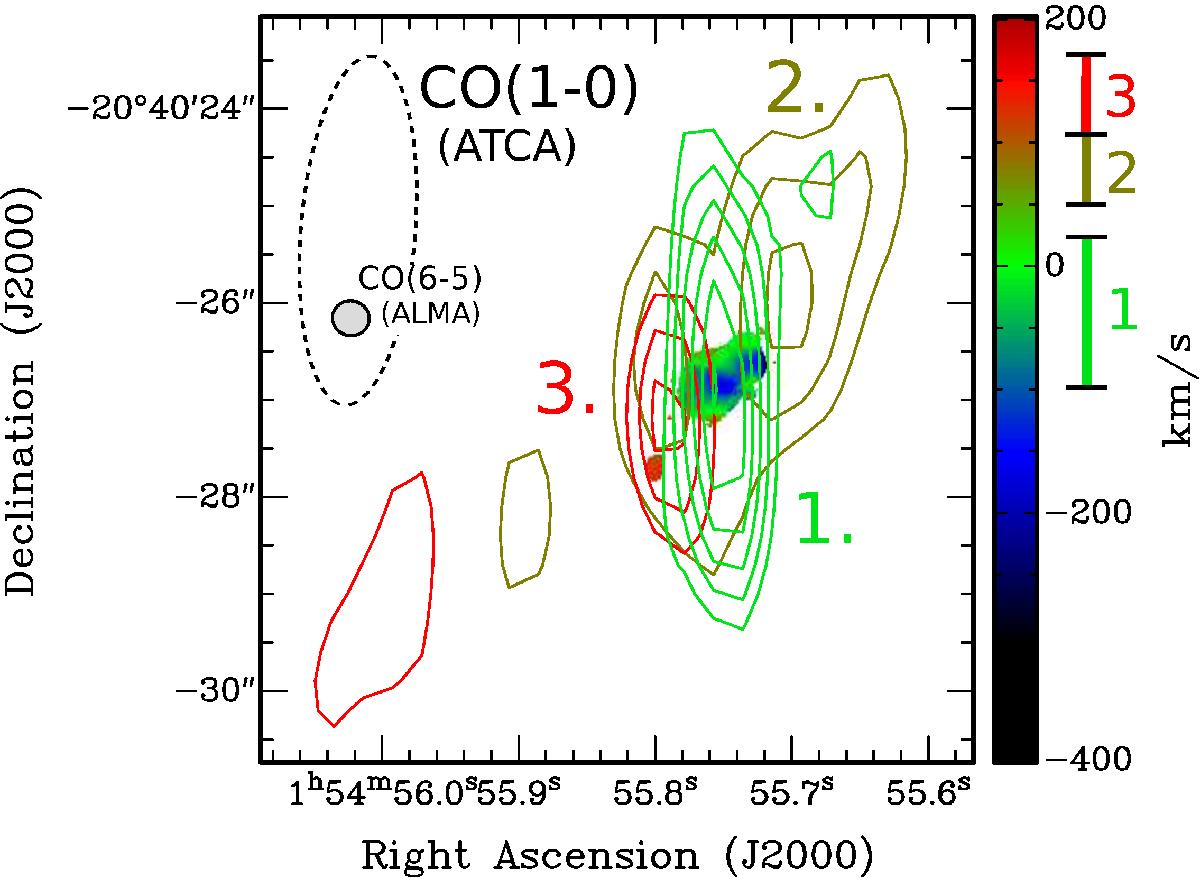
Velocity map of CO(6−5) from Fig. 2 overlaid onto CO(1−0) contours from ATCA, derived by integrating the CO(1−0) across the velocity ranges –100 − +20 km s-1 (light-green #1), +50 − +110 km s-1 (dark-green #2) and +110 − +170 km s-1 (red #3) (EM15). Levels: 2.8, 3.5, 4.2, 4.9, 5.6, 6.3 ×σ (σ = 12 mJy beam-1 × km s-1 for component #1 and σ = 7.3 mJy beam-1 × km s-1 for components #2 and #3). The color-codings of the CO(1−0) contours and CO(6−5) velocity map are closely matched.
Current usage metrics show cumulative count of Article Views (full-text article views including HTML views, PDF and ePub downloads, according to the available data) and Abstracts Views on Vision4Press platform.
Data correspond to usage on the plateform after 2015. The current usage metrics is available 48-96 hours after online publication and is updated daily on week days.
Initial download of the metrics may take a while.