Fig. 3
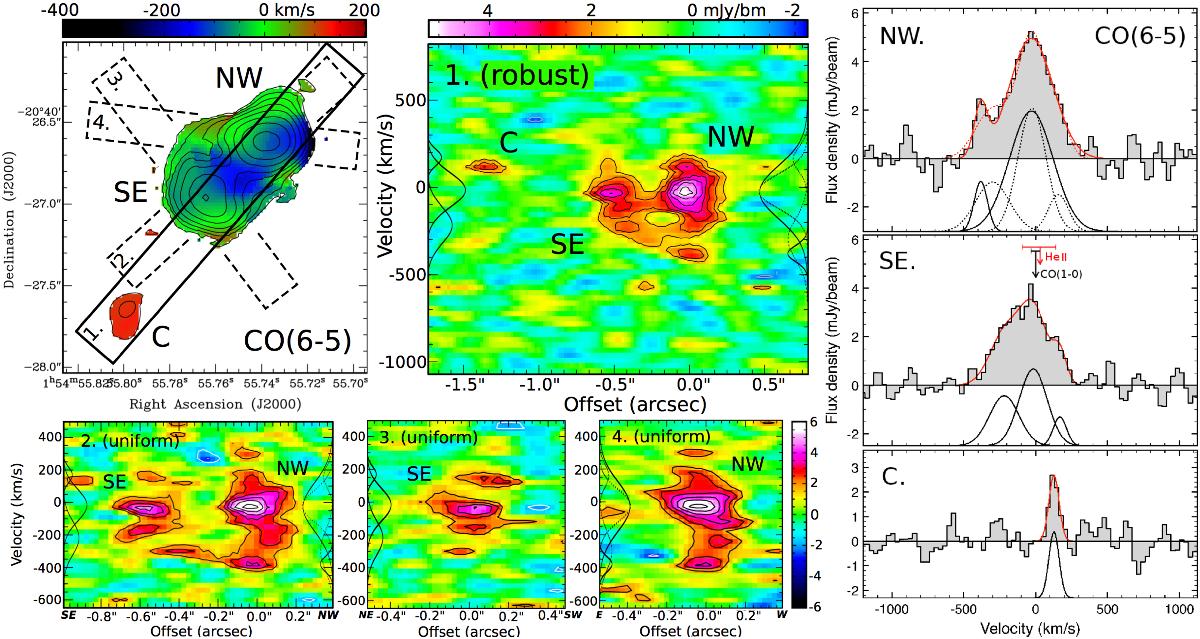
CO(6−5) kinematics. All velocities are with respect to z = 1.9212 (EM11). Top left: 1st moment velocity map of the CO(6−5) emission, with overlaid contours of the CO(6−5) total intensity at the same levels as those shown in Fig. 2. Also indicated are four pseudo-slits along which we extracted the position-velocity plots shown in the middle and bottom (solid for the robust +0.5 weighted data and dashed for the uniform weighted data). The width of the pseudo-slits indicates the spatial resolution. Top middle: position-velocity plot of the robust +0.5 weighted CO(6−5) data set, which highlights the bridge-like structures between NW and SE at v< −250 km s-1 and v ~ 0 km s-1 (PA = −41°; direction SE to NW). Contour levels: –4, –3, 3, 4, 5, 6, 7, 8, 9σ, with σ = 0.54 mJy beam-1. For guidance, along the y-axis we plot the velocity coverage of the Gaussian model components shown in the spectra on the right. Bottom: position-velocity plots derived from the uniform weighted CO(6−5) data, which best show the kinematic details (beamsize 0.27′′ × 0.23′′ at PAbeam = 57°). The PV-plots are taken along the dashed axes indicated in the top-left plot and all offsets are shown from (north/south)-east to (south/north)-west. Contour levels: –3, –2, 2, 3, 4, 5, 6, 7σ, with σ = 0.88 mJy beam-1. Right: CO(6−5) spectra of the three components (NW, SE and C). The redshifts zCO(1−0) (EM11) and zHeII (EM15), and their uncertainty, are indicated with an arrow + bar. Also shown are the best-fit model (solid red line) and corresponding individual components (solid black Gaussians lines), as well as an alternative model for NW (dotted lines); see text for details.
Current usage metrics show cumulative count of Article Views (full-text article views including HTML views, PDF and ePub downloads, according to the available data) and Abstracts Views on Vision4Press platform.
Data correspond to usage on the plateform after 2015. The current usage metrics is available 48-96 hours after online publication and is updated daily on week days.
Initial download of the metrics may take a while.