Fig. 1
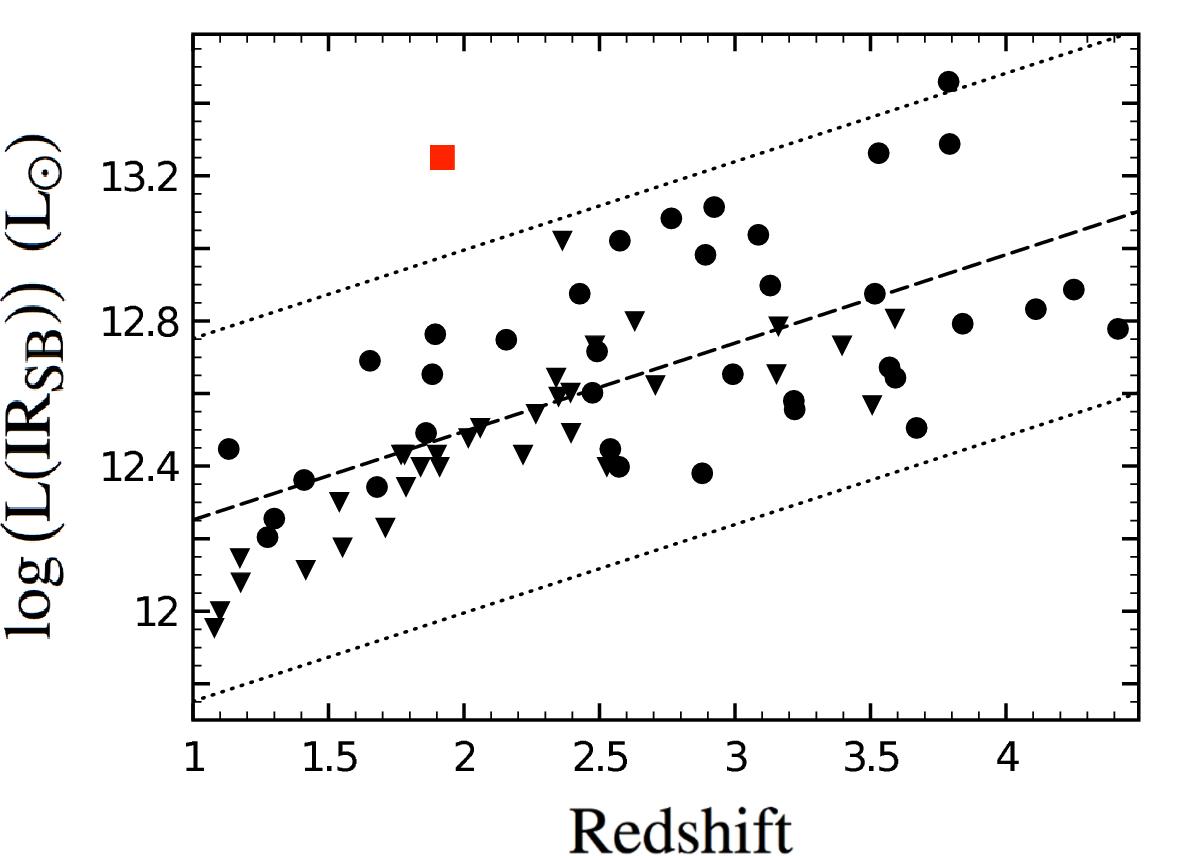
Starburst IR luminosity plotted against redshift for HzRGs (plot adapted from Drouart et al. 2014). Any contribution from the AGN to the IR luminosity was carefully subtracted through fitting the spectral energy distribution with Spitzer and Herschel photometry (Drouart et al. 2014). Solid circles are the IR detections, triangles the IR upper limits, and the red square is the Dragonfly Galaxy. The dashed line shows the best fit to the data, with the dotted lines ±0.5 dex. The Dragonfly Galaxy is the only HzRG that deviates from the general trend by ~0.8 dex.
Current usage metrics show cumulative count of Article Views (full-text article views including HTML views, PDF and ePub downloads, according to the available data) and Abstracts Views on Vision4Press platform.
Data correspond to usage on the plateform after 2015. The current usage metrics is available 48-96 hours after online publication and is updated daily on week days.
Initial download of the metrics may take a while.