Fig. 4
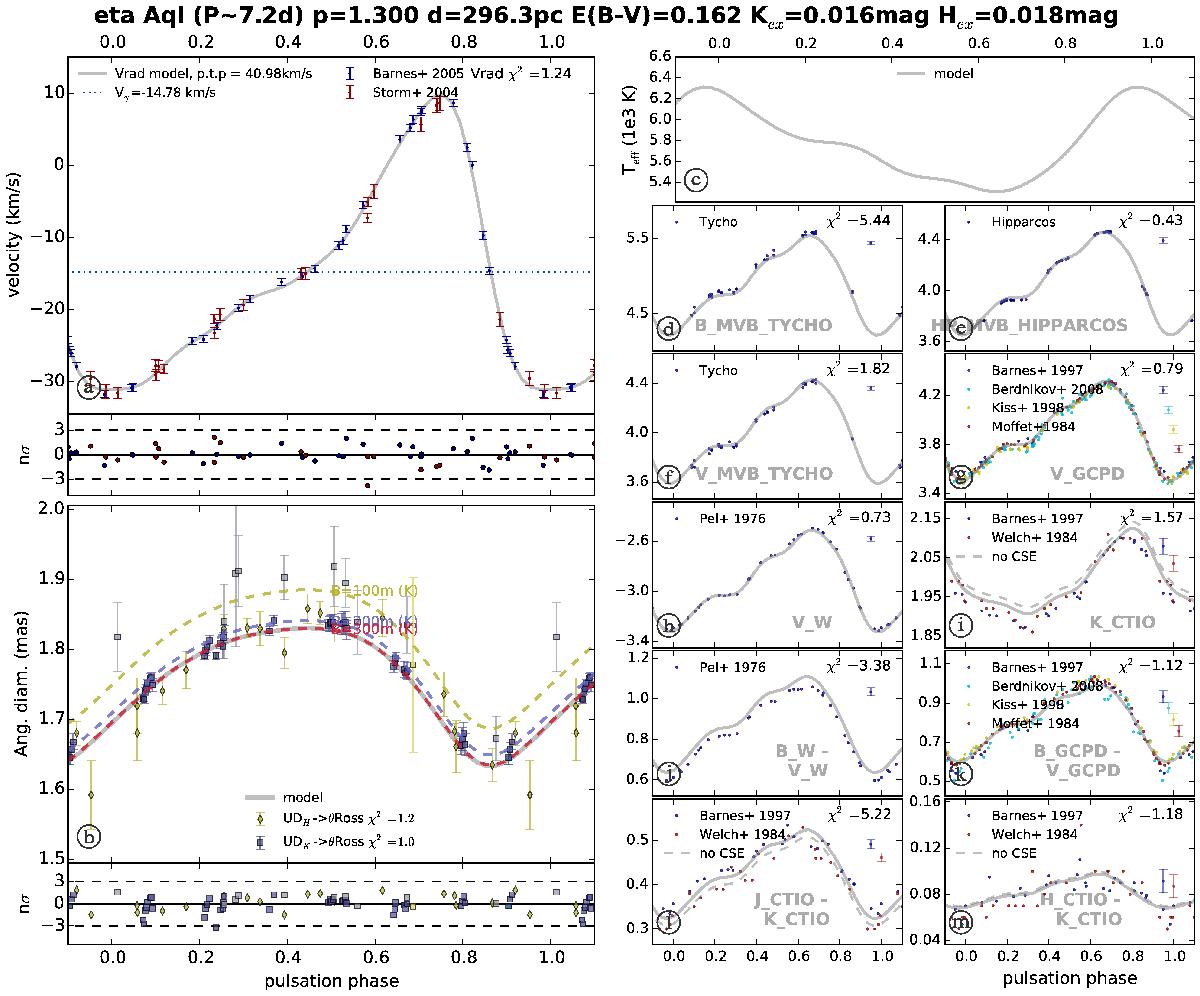
η Aql fit. Various panels show pulsation and radial velocities with spline model and residuals (panel a)); angular diameters and residuals, with the baseline color-coded for the data and CSE-biased model – as a dash line, based on the model shown in Fig. 2 – (panel b)); effective temperatures (panel c)); photometric measurements and model (panels d) to m)) for different photometric bands or colors. Typical error bars are shown on the right side of the plot, below the reduced χ2 values.
Current usage metrics show cumulative count of Article Views (full-text article views including HTML views, PDF and ePub downloads, according to the available data) and Abstracts Views on Vision4Press platform.
Data correspond to usage on the plateform after 2015. The current usage metrics is available 48-96 hours after online publication and is updated daily on week days.
Initial download of the metrics may take a while.