Fig. 1
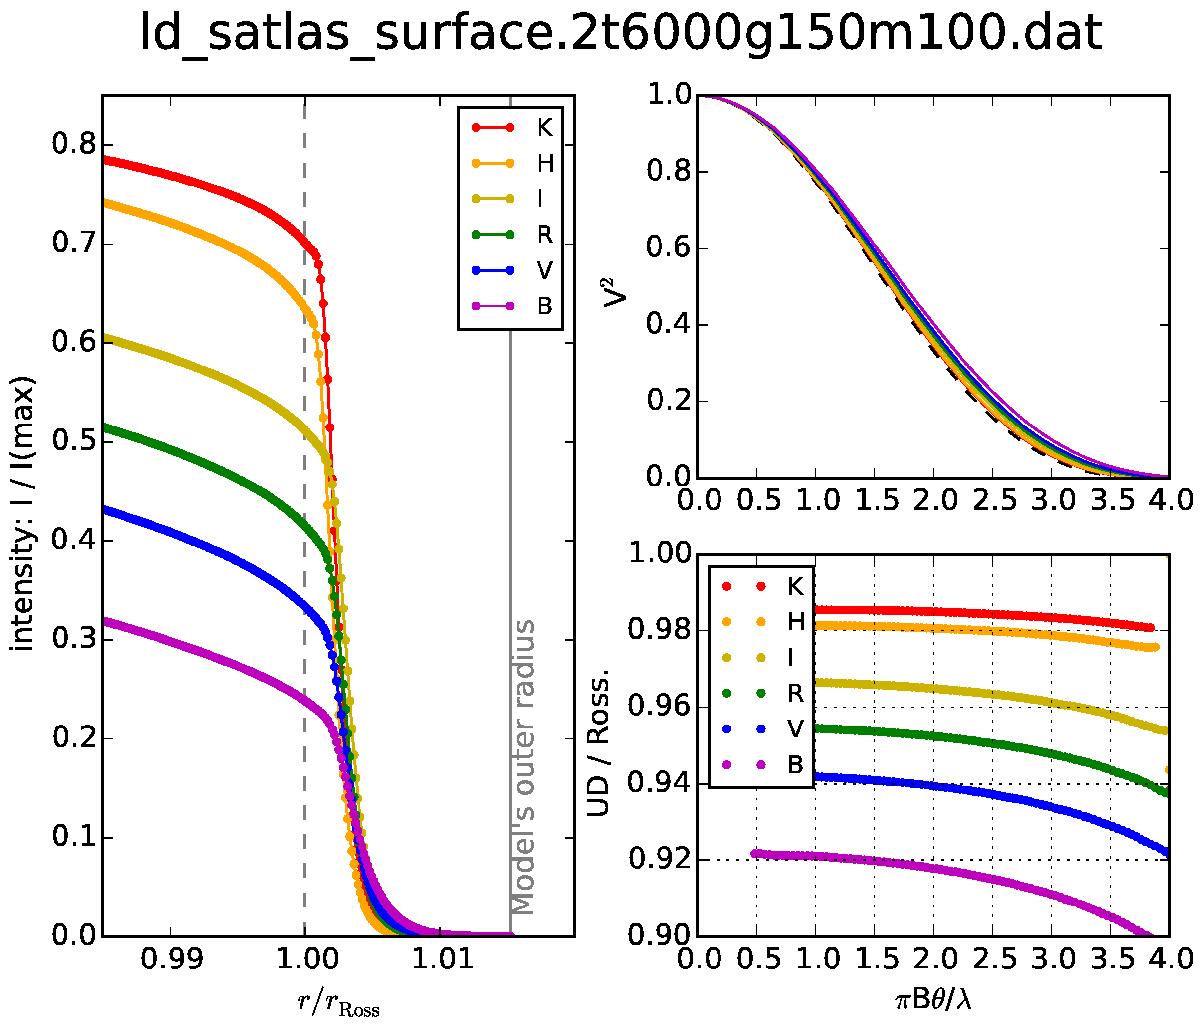
Example of deriving the interferometric correction factor θUD/θRoss. for SATLAS model Teff = 6000 K, log g = 1.5 and M = 10 M⊙. Left: radial intensity profile, close to the limb (± 1%), for various bands; upper right: corresponding visibility functions as a function of the dimensionless spatial frequency x = πBθ/λ; lower right: corresponding factors θUD/θRoss. for each band as a function of x.
Current usage metrics show cumulative count of Article Views (full-text article views including HTML views, PDF and ePub downloads, according to the available data) and Abstracts Views on Vision4Press platform.
Data correspond to usage on the plateform after 2015. The current usage metrics is available 48-96 hours after online publication and is updated daily on week days.
Initial download of the metrics may take a while.