Fig. 6
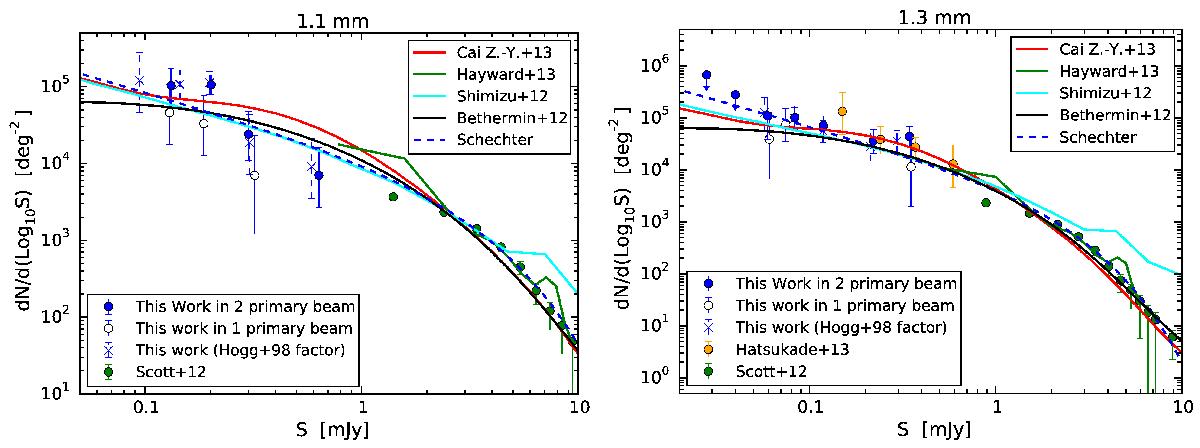
Logarithmic differential number counts as a function of flux density at λ = 1.1 mm and λ = 1.3 mm. The blue solid and upper limit symbols are the results of this work. The hollow symbols are the results obtained by using only the sources within one primary beam. The blue crosses with dashed error bars are the differential number counts corrected for flux boosting by using Eq. (4) in Hogg & Turner (1998). The green symbols are estimated from Scott et al. (2012). The orange symbols are the number counts estimated by Hatsukade et al. (2013). The red, green, cyan, and black solid curves are the model predictions obtained by Cai et al. (2013), Hayward et al. (2013), Shimizu et al. (2012), and Béthermin et al. (2012), respectively. The blue dashed curve shows the best-fit Schechter function.
Current usage metrics show cumulative count of Article Views (full-text article views including HTML views, PDF and ePub downloads, according to the available data) and Abstracts Views on Vision4Press platform.
Data correspond to usage on the plateform after 2015. The current usage metrics is available 48-96 hours after online publication and is updated daily on week days.
Initial download of the metrics may take a while.