Free Access
Fig. 4
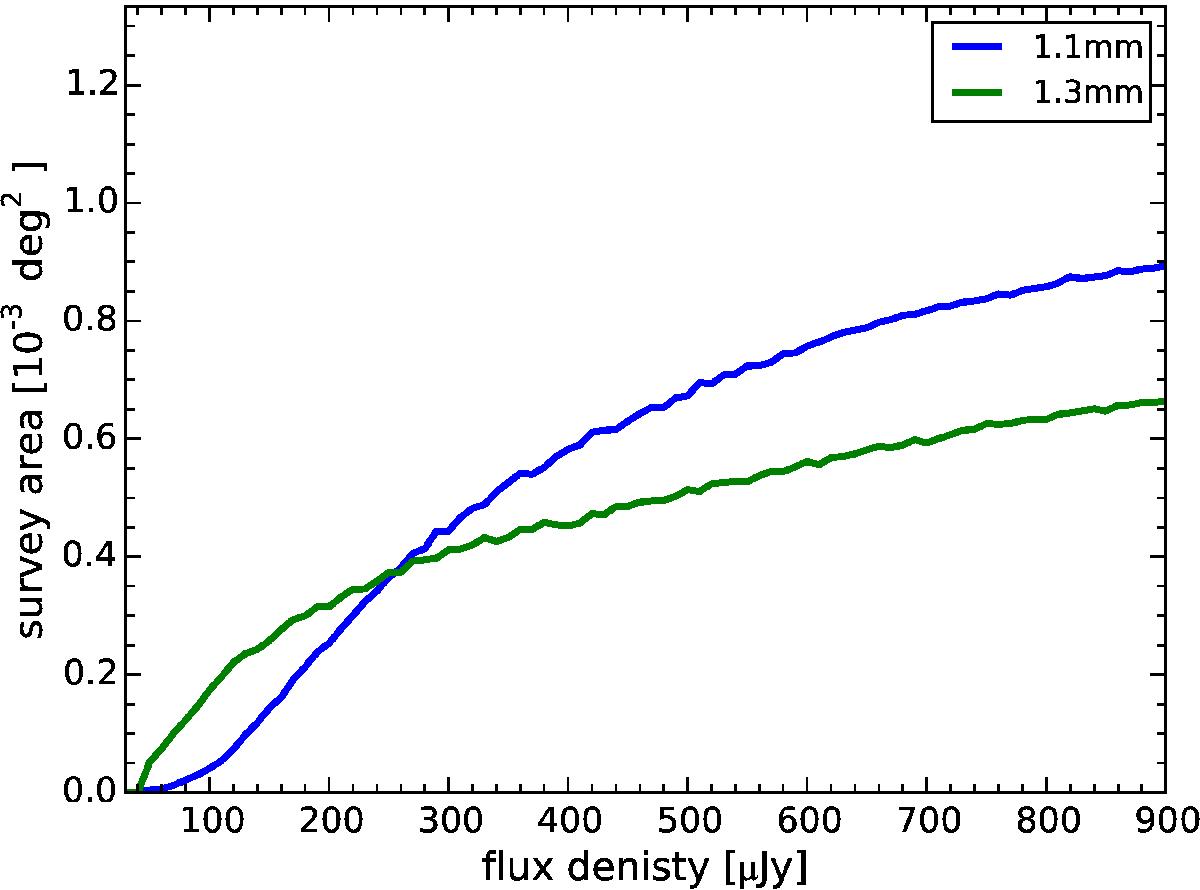
Effective survey area as a function of intrinsic flux density. This is the area over which a source with an intrinsic flux density S can be detected with S/N> 3.5σ. The blue and green curves are the survey areas for the maps at 1.1 mm and 1.3 mm, respectively.
Current usage metrics show cumulative count of Article Views (full-text article views including HTML views, PDF and ePub downloads, according to the available data) and Abstracts Views on Vision4Press platform.
Data correspond to usage on the plateform after 2015. The current usage metrics is available 48-96 hours after online publication and is updated daily on week days.
Initial download of the metrics may take a while.