Fig. 1
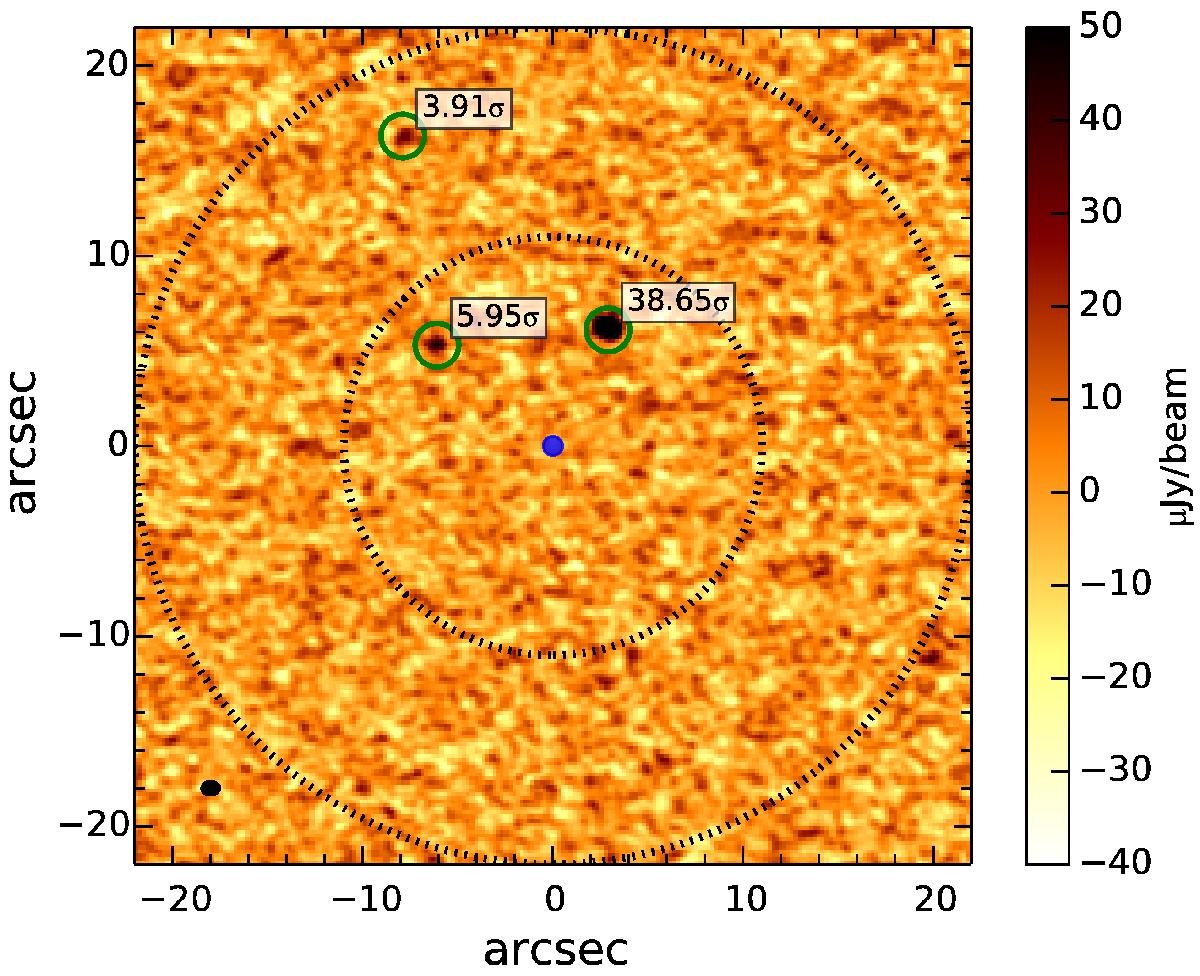
Example of a Band 6 continuum map obtained with ALMA (field a Table 1). The green circles represent the sources detected with S/N> 3.5σ that also fulfil the requirement of having a size consistent with the beam (or marginally resolved). The inner black dotted circle indicates the primary beam and the outer circle shows twice the primary beam. The blue filled circle shows the masked region. The synthesised beam is indicated by a filled black ellipse in the lower left corner of the plot.
Current usage metrics show cumulative count of Article Views (full-text article views including HTML views, PDF and ePub downloads, according to the available data) and Abstracts Views on Vision4Press platform.
Data correspond to usage on the plateform after 2015. The current usage metrics is available 48-96 hours after online publication and is updated daily on week days.
Initial download of the metrics may take a while.