Fig. C.1
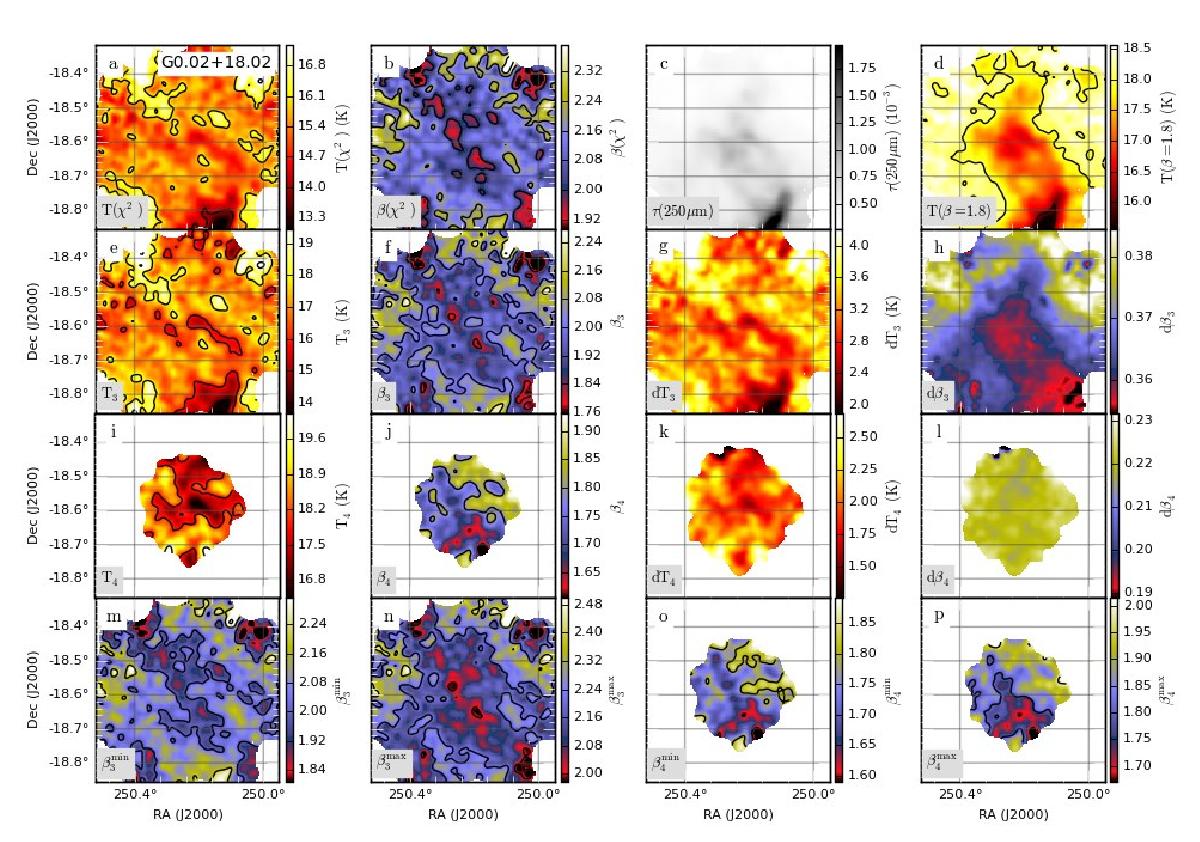
Temperature and spectral index fits of field G0.02+18.02 using Herschel data. Frames are: colour temperature and spectral index with SPIRE data and χ2 minimisation (frames a)–b)), 250μm optical depth and colour temperature for SPIRE data and β = 1.8 (frames c)–d)), colour temperature and spectral index with SPIRE data and MCMC calculations (frame e)–f)) and the corresponding error maps (frames g)–h)), MCMC results for 160–500 μm fits (frames i)–j)) with corresponding error estimates (frames k)–l)). The last frames show the effect of zero point uncertainty in the three-band fits (frames m)–n)) and four-band fits (frame o)–p)) (χ2 fits) based on Monte Carlo simulation using χ2 fits. Temperature maps have contours drawn at intervals of 2.0 K, starting at 10.0 K. Spectral index maps have contours at intervals of 0.2, starting at 1.0.
Current usage metrics show cumulative count of Article Views (full-text article views including HTML views, PDF and ePub downloads, according to the available data) and Abstracts Views on Vision4Press platform.
Data correspond to usage on the plateform after 2015. The current usage metrics is available 48-96 hours after online publication and is updated daily on week days.
Initial download of the metrics may take a while.