Fig. 9
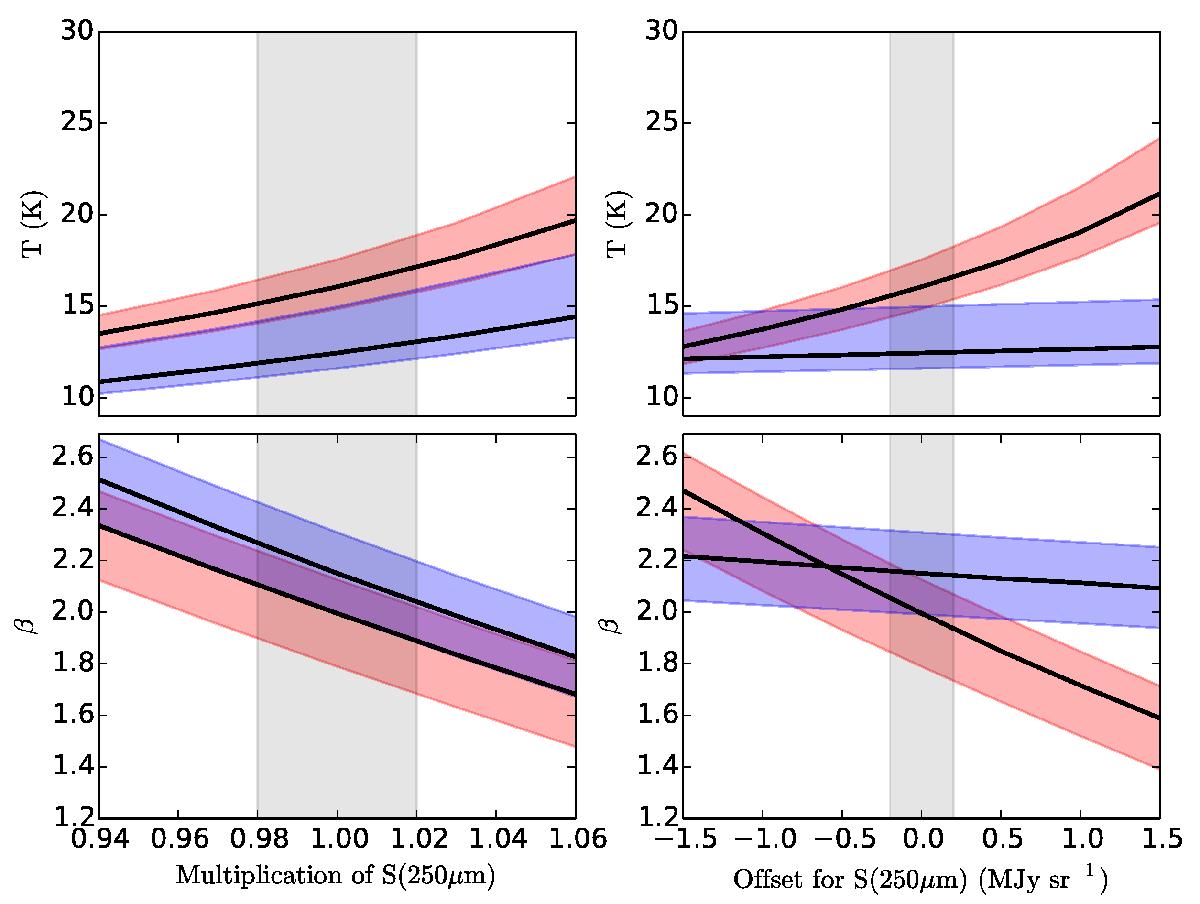
T and β values for pixels with 350 μm surface brightness ~10 MJy sr-1 (red band) and ~100 MJy sr-1 (blue band). The values are plotted as a function of multiplicative (left frames) and additive (right frames) modifications of the measured 250 μm surface brightness. The solid curves are the median values (calculated over all fields) and the shaded region between the 25% and 75% percentiles indicates the field-to-field dispersion. The grey vertical bands correspond to the probable uncertainties of ~2% in the relative gain calibration and ±0.2 MJy sr-1 in the surface brightness zero point.
Current usage metrics show cumulative count of Article Views (full-text article views including HTML views, PDF and ePub downloads, according to the available data) and Abstracts Views on Vision4Press platform.
Data correspond to usage on the plateform after 2015. The current usage metrics is available 48-96 hours after online publication and is updated daily on week days.
Initial download of the metrics may take a while.