Fig. 7
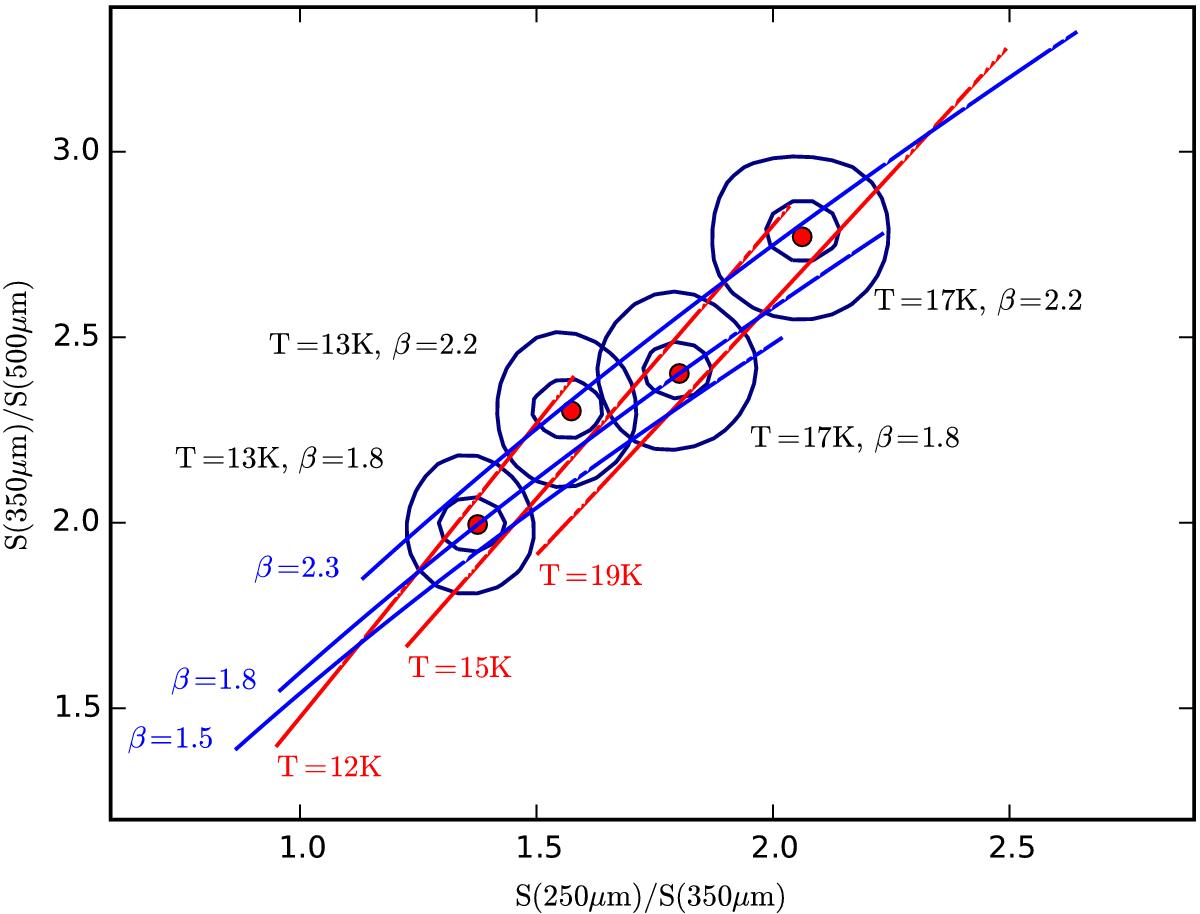
Illustration of the degeneracy between T and β in a SPIRE colour–colour plot. The solid lines correspond to constant values of β or T. The lengths of the lines correspond to a temperature range of 10–23 K or a spectral index range of 1.0–2.5, respectively. Four distinct parameter pairs are plotted as red dots. The surrounding contours indicate the FWHM extent of the estimated parameter distributions in case of 1% or 5% uncertainty in all surface brightness data.
Current usage metrics show cumulative count of Article Views (full-text article views including HTML views, PDF and ePub downloads, according to the available data) and Abstracts Views on Vision4Press platform.
Data correspond to usage on the plateform after 2015. The current usage metrics is available 48-96 hours after online publication and is updated daily on week days.
Initial download of the metrics may take a while.