Fig. 6
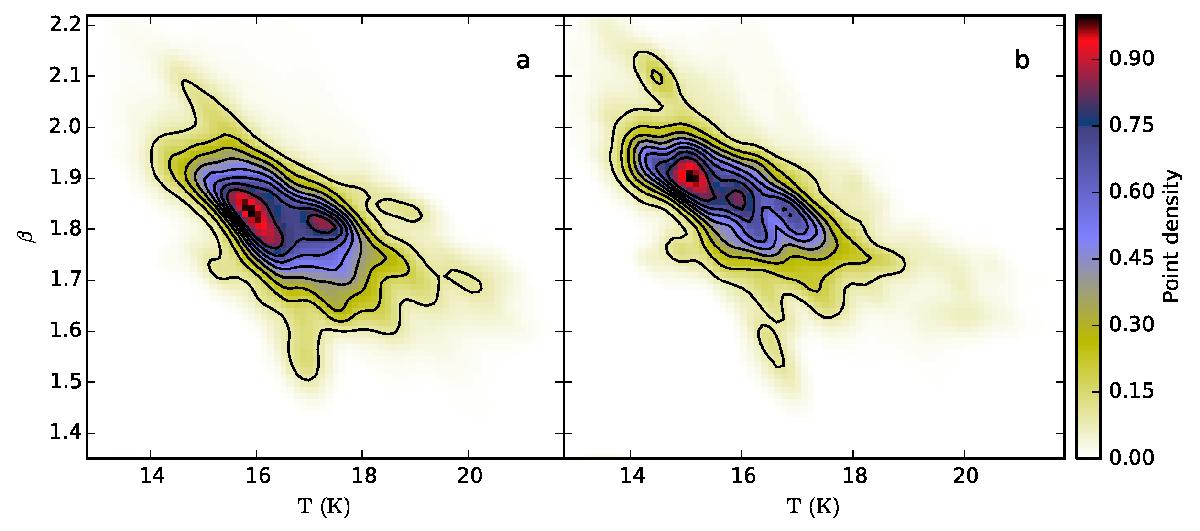
Distribution of T and β values estimated with IRIS 100 μm data and Planck data at frequencies 353 GHz and higher. The values have been calculated pixel-by-pixel using maps at a resolution of 5′. Left frame contains all pixels inside the coverage of SPIRE maps. Right frame contains from each field only 25% of the pixels with the highest column densities (fourth quartile). The column densities have been estimated using the same data and a fixed value of spectral index, β = 1.8.
Current usage metrics show cumulative count of Article Views (full-text article views including HTML views, PDF and ePub downloads, according to the available data) and Abstracts Views on Vision4Press platform.
Data correspond to usage on the plateform after 2015. The current usage metrics is available 48-96 hours after online publication and is updated daily on week days.
Initial download of the metrics may take a while.