Fig. B.1
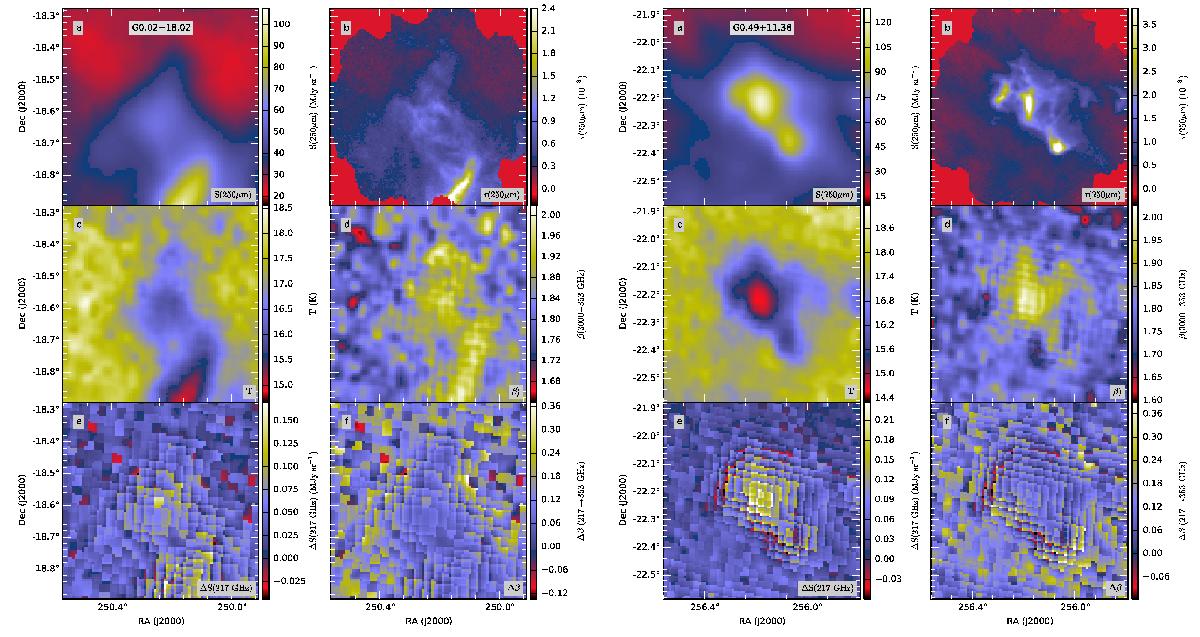
Modified blackbody fits to Planck and IRIS data in fields G0.02+18.02 and G0.49+11.38. The frames a), c), and d) show 250 μm surface brightness, colour temperature, and spectral index fitted to 3000 GHz (IRAS 100 μm), 857 GHz, 545 GHz, and 353 GHz data, respectively. Frame b) shows the higher resolution Herschel τ(250 μm) map. Frame e) is the surface brightness residual between the 217 GHz observation and the above fit. The last frame shows the difference between spectral indices derived with fits to 3000–353 GHz and to 3000–217 GHz data. The fields in this and the following figures are in order of increasing galactic longitude.
Current usage metrics show cumulative count of Article Views (full-text article views including HTML views, PDF and ePub downloads, according to the available data) and Abstracts Views on Vision4Press platform.
Data correspond to usage on the plateform after 2015. The current usage metrics is available 48-96 hours after online publication and is updated daily on week days.
Initial download of the metrics may take a while.