Fig. A.3
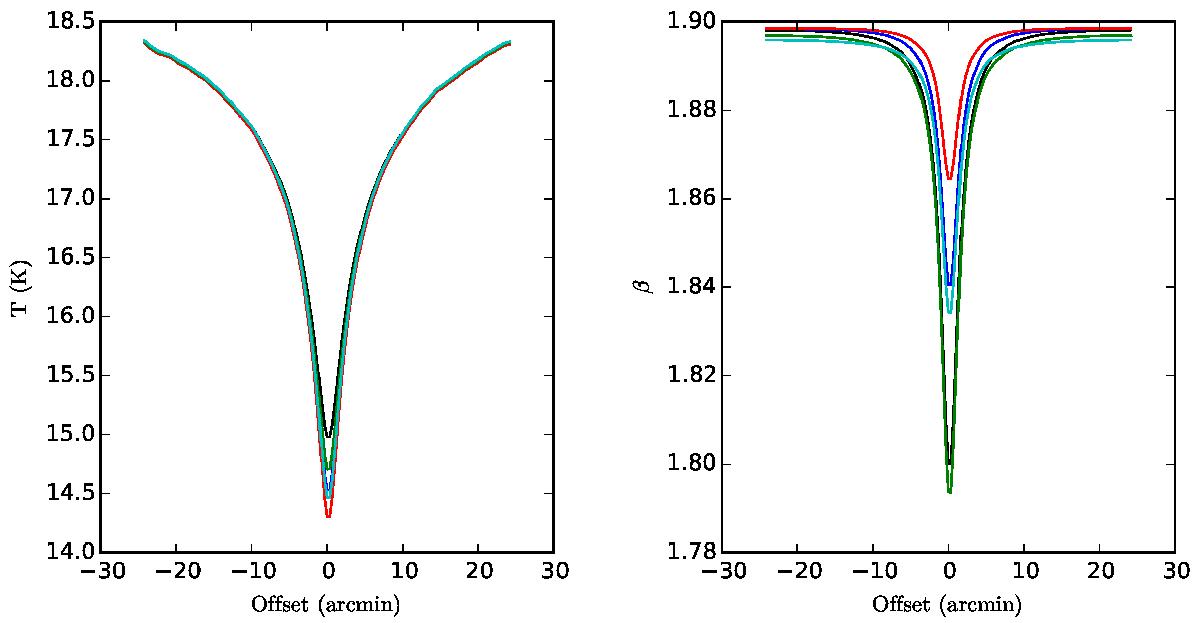
Temperature and spectral index profiles of the τ(V) = 10 model observed using different wavelength combinations. In order of decreasing colour temperature these are: 100, 350, 550, and 850 μm (black curves), 160, 250, 350, and 500 μm (green curves), 160, 350, 550, and 850 μm (blue curves), 250, 350, and 500 μm (cyan curves), 250, 350, 550, and 850 μm (red curves).
Current usage metrics show cumulative count of Article Views (full-text article views including HTML views, PDF and ePub downloads, according to the available data) and Abstracts Views on Vision4Press platform.
Data correspond to usage on the plateform after 2015. The current usage metrics is available 48-96 hours after online publication and is updated daily on week days.
Initial download of the metrics may take a while.