Fig. 3
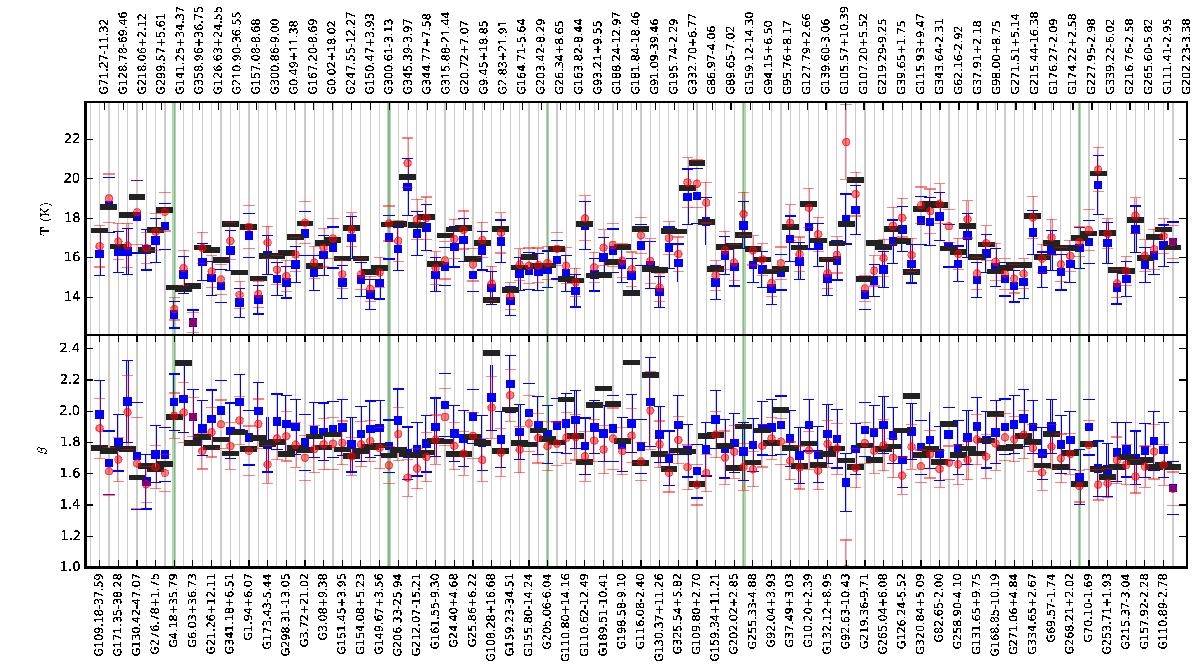
Colour temperature (upper frame) and spectral index values (lower frame) for the 116 fields. For clarity, alternating field names appear above and below the figure. The values are derived from IRIS and Planck data, averaged over a single FWHM = 10′ beam. Estimates are calculated with (red circles) and without (blue squares) the 217 GHz band. The black horizontal bars show values derived without the 217 GHz band, using surface brightness averaged over a larger beam with FWHM = 30′. The fields are arranged in the order of increasing distance (Montillaud et al. 2015). The five vertical lines indicate the first fields with estimated distances above 0, 200, 400, 800, and 2000 pc. The first eight fields do not have reliable distance estimates.
Current usage metrics show cumulative count of Article Views (full-text article views including HTML views, PDF and ePub downloads, according to the available data) and Abstracts Views on Vision4Press platform.
Data correspond to usage on the plateform after 2015. The current usage metrics is available 48-96 hours after online publication and is updated daily on week days.
Initial download of the metrics may take a while.