Fig. A.2
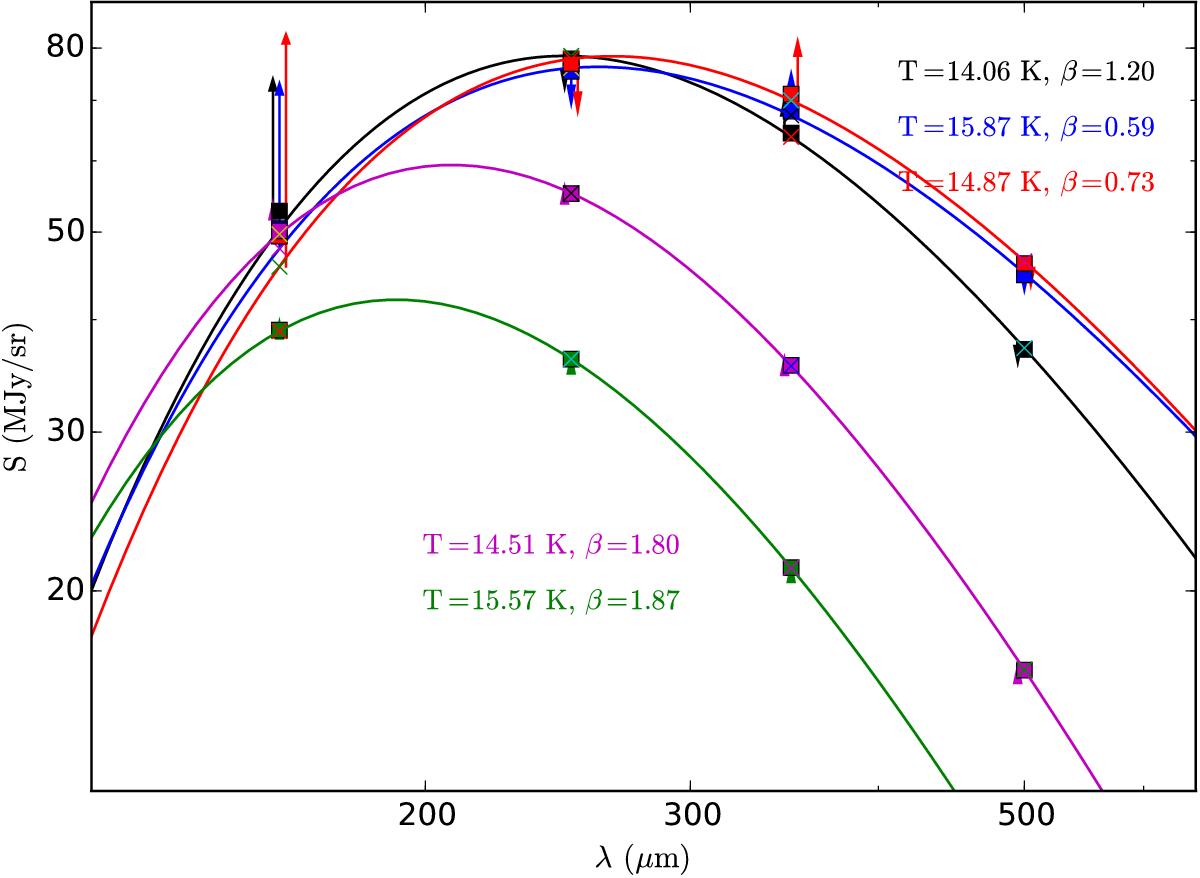
Selected SEDs from τV = 50.0 models. The uppermost three spectra are towards the centre of the filament, using the original dust model (black line) or using β = 1.7 dust (blue line) or β = 2.2 dust (red line) in the central part of the filament. The lower spectra (magenta and green) correspond to larger offsets (4.4 and 8.7 arcmin) from the symmetry axis that are not directly affected by the dust modifications. The differences between the measured points and the modified blackbody curves are indicated with vertical arrows. The length of the arrow is ten times the difference between the data point and the fitted modified blackbody curve.
Current usage metrics show cumulative count of Article Views (full-text article views including HTML views, PDF and ePub downloads, according to the available data) and Abstracts Views on Vision4Press platform.
Data correspond to usage on the plateform after 2015. The current usage metrics is available 48-96 hours after online publication and is updated daily on week days.
Initial download of the metrics may take a while.