Fig. 27
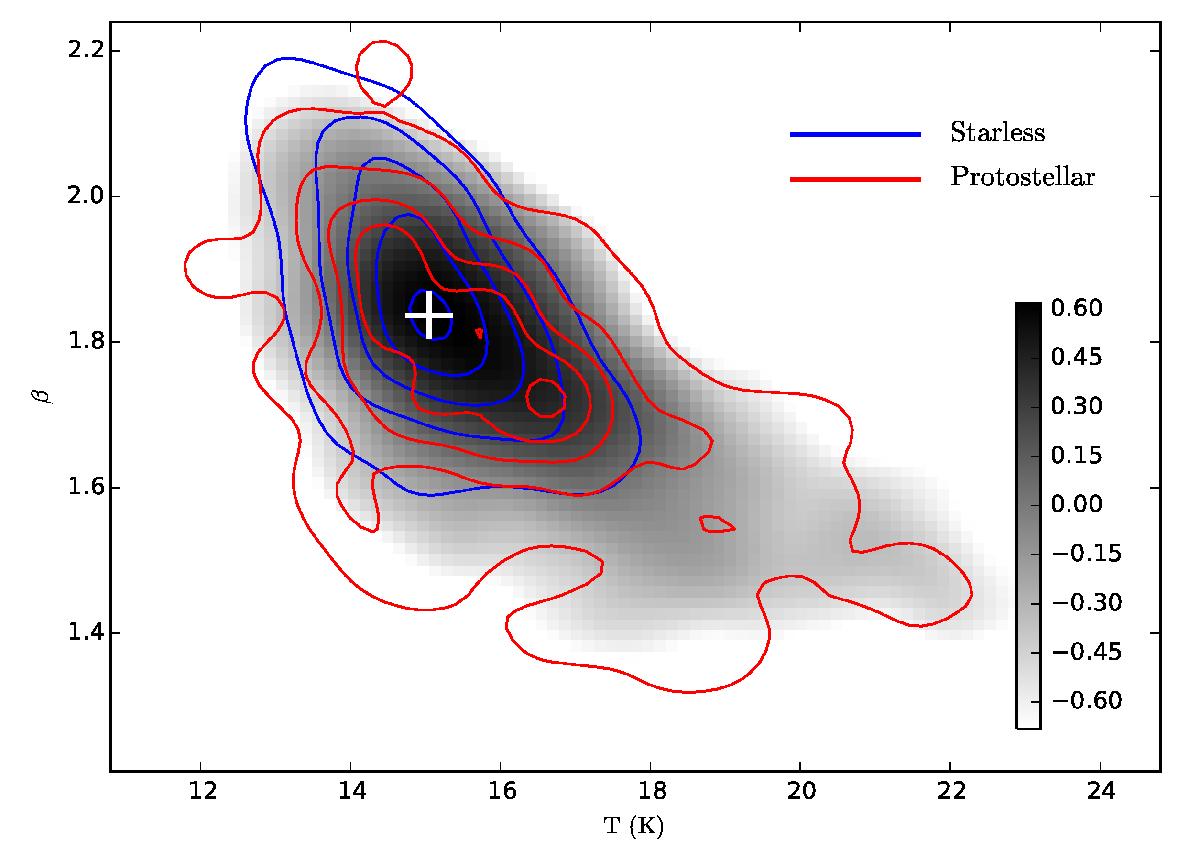
Temperature and spectral index values towards the submillimetre clumps catalogued in Montillaud et al. (2015). The blue and red contours correspond to starless and protostellar clumps respectively. There are five equally spaced contours between 15% and 90% of the peak density of points. The background grayscale image and the colour bar show the distribution of unclassified clumps (logarithm of the number of clumps per bins of ΔT = 0.14 K and Δβ = 0.014). The white cross shows the peak of this distribution. The plotted data have been smoothed with a Gaussian with FWHM equal to 1.0 K and 0.1 units in β.
Current usage metrics show cumulative count of Article Views (full-text article views including HTML views, PDF and ePub downloads, according to the available data) and Abstracts Views on Vision4Press platform.
Data correspond to usage on the plateform after 2015. The current usage metrics is available 48-96 hours after online publication and is updated daily on week days.
Initial download of the metrics may take a while.