Fig. 26
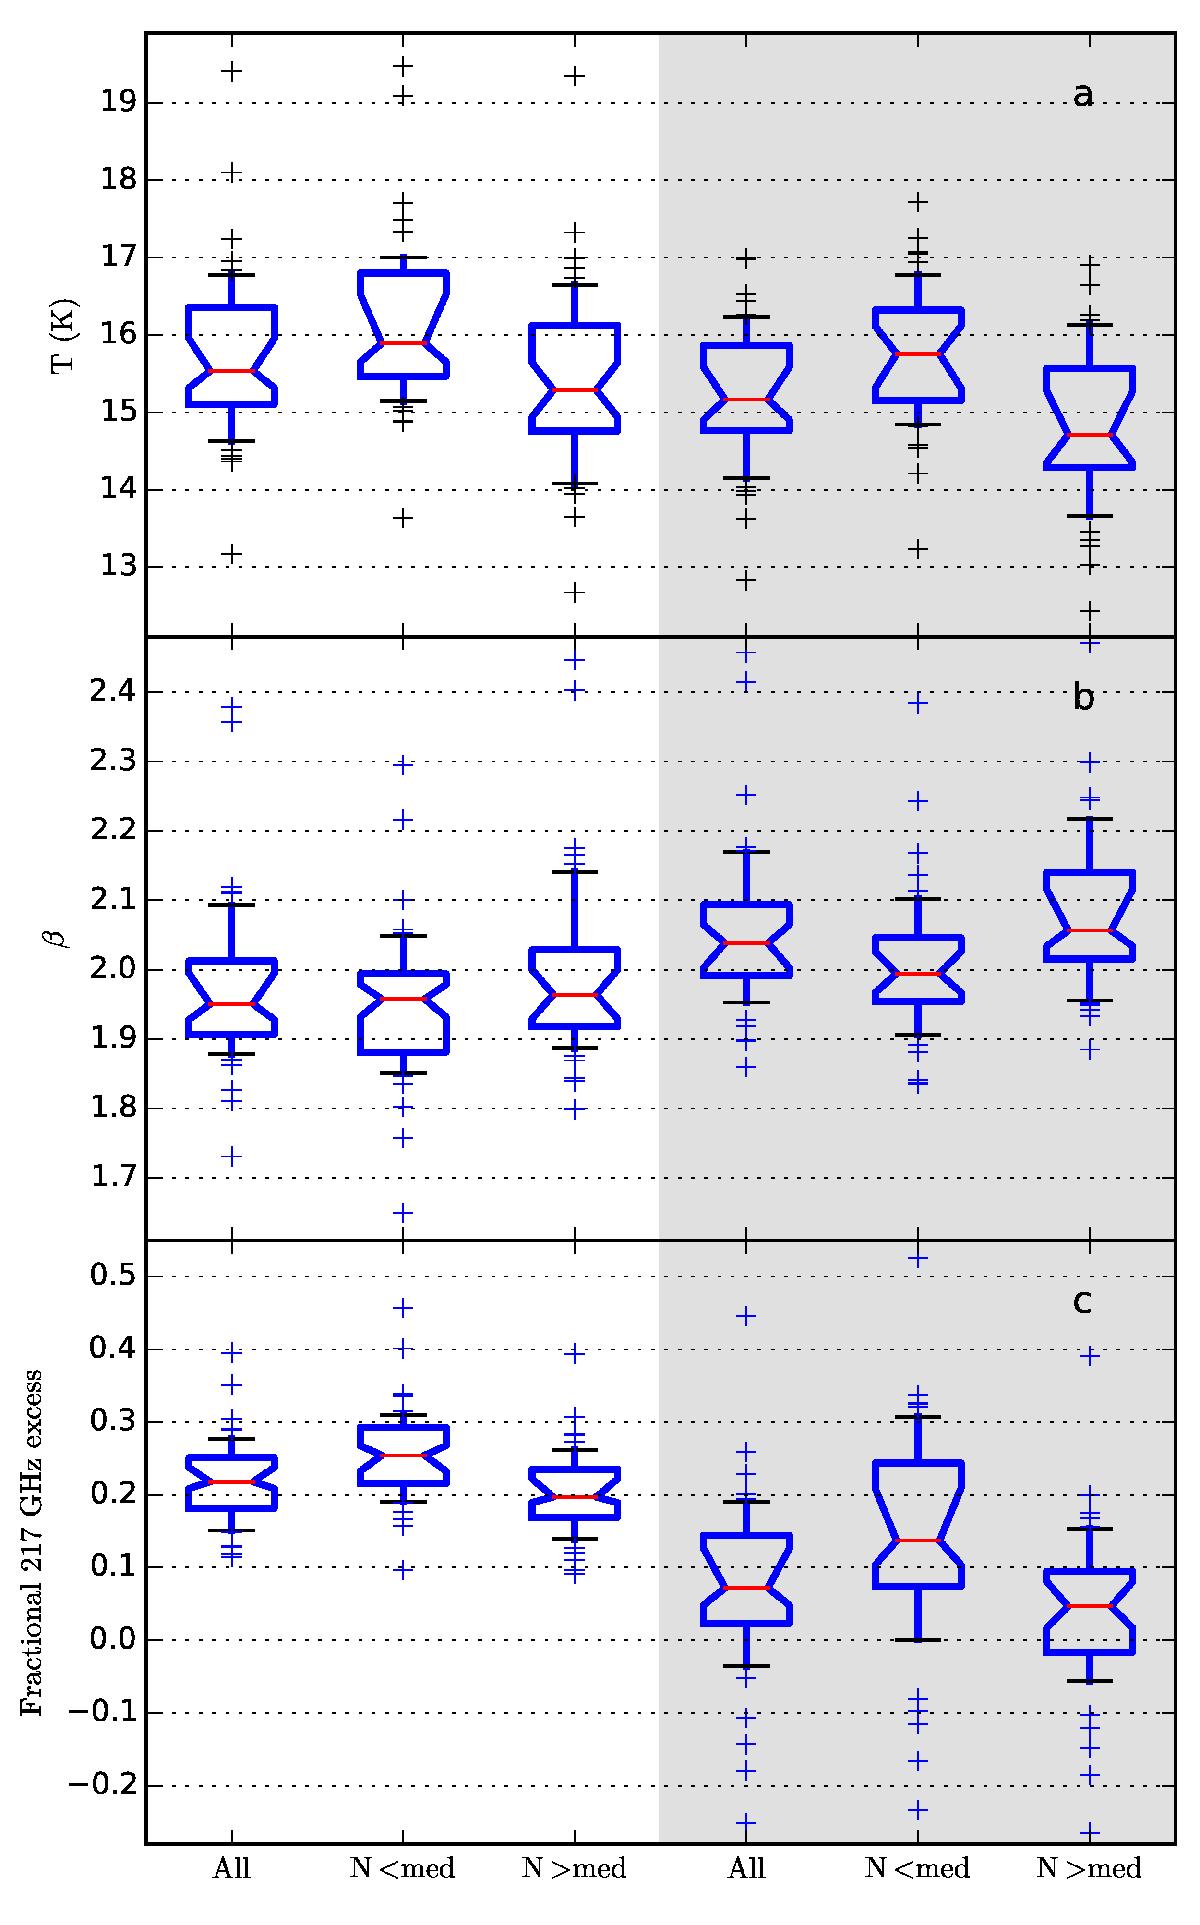
Comparison of fits of Planck and Herschel data in case of different corrections for CO emission. The boxplots show the distribution of field-averaged values of T, β, and 217 GHz excess (relative to fitted modified grey body model, ~5′ resolution). Distributions are plotted dividing each field to pixels below (“N< med”) and above (“N> med”) the median column density. The plots on white background correspond to the default CO correction and the plots on grey background to a CO correction that is twice as high. Each boxplot shows the median parameter value (red horizontal line), the interquartile range (box), and the 10%–90% extent of the distribution (“whiskers”). Each individual field outside the [10, 90%] range is plotted with a plus sign.
Current usage metrics show cumulative count of Article Views (full-text article views including HTML views, PDF and ePub downloads, according to the available data) and Abstracts Views on Vision4Press platform.
Data correspond to usage on the plateform after 2015. The current usage metrics is available 48-96 hours after online publication and is updated daily on week days.
Initial download of the metrics may take a while.