Fig. 25
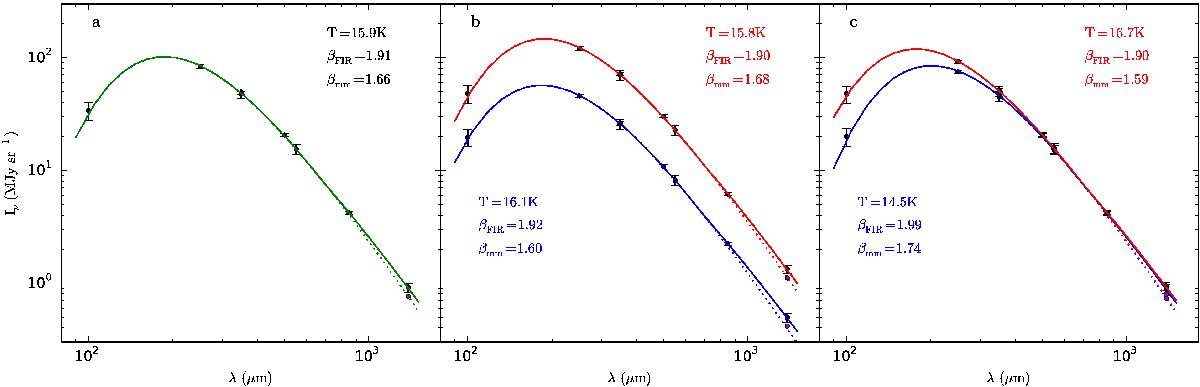
Spectral energy distributions based on surface brightness averaged over fields and over 10′ beams towards the centre of each field. Frame a) corresponds to the average over all fields, frame b) to averages over fields below (blue) and above (red) the median column density, and frame c) to averages over fields below and above the median temperature. The dotted lines are long-wavelength extrapolations using βFIR. At 217 GHz the lower points (without error bars) correspond to data that have been corrected assuming a line ratio of (2–1)/(1–0) = 1.0 and thus with twice the default CO correction.
Current usage metrics show cumulative count of Article Views (full-text article views including HTML views, PDF and ePub downloads, according to the available data) and Abstracts Views on Vision4Press platform.
Data correspond to usage on the plateform after 2015. The current usage metrics is available 48-96 hours after online publication and is updated daily on week days.
Initial download of the metrics may take a while.