Fig. 24
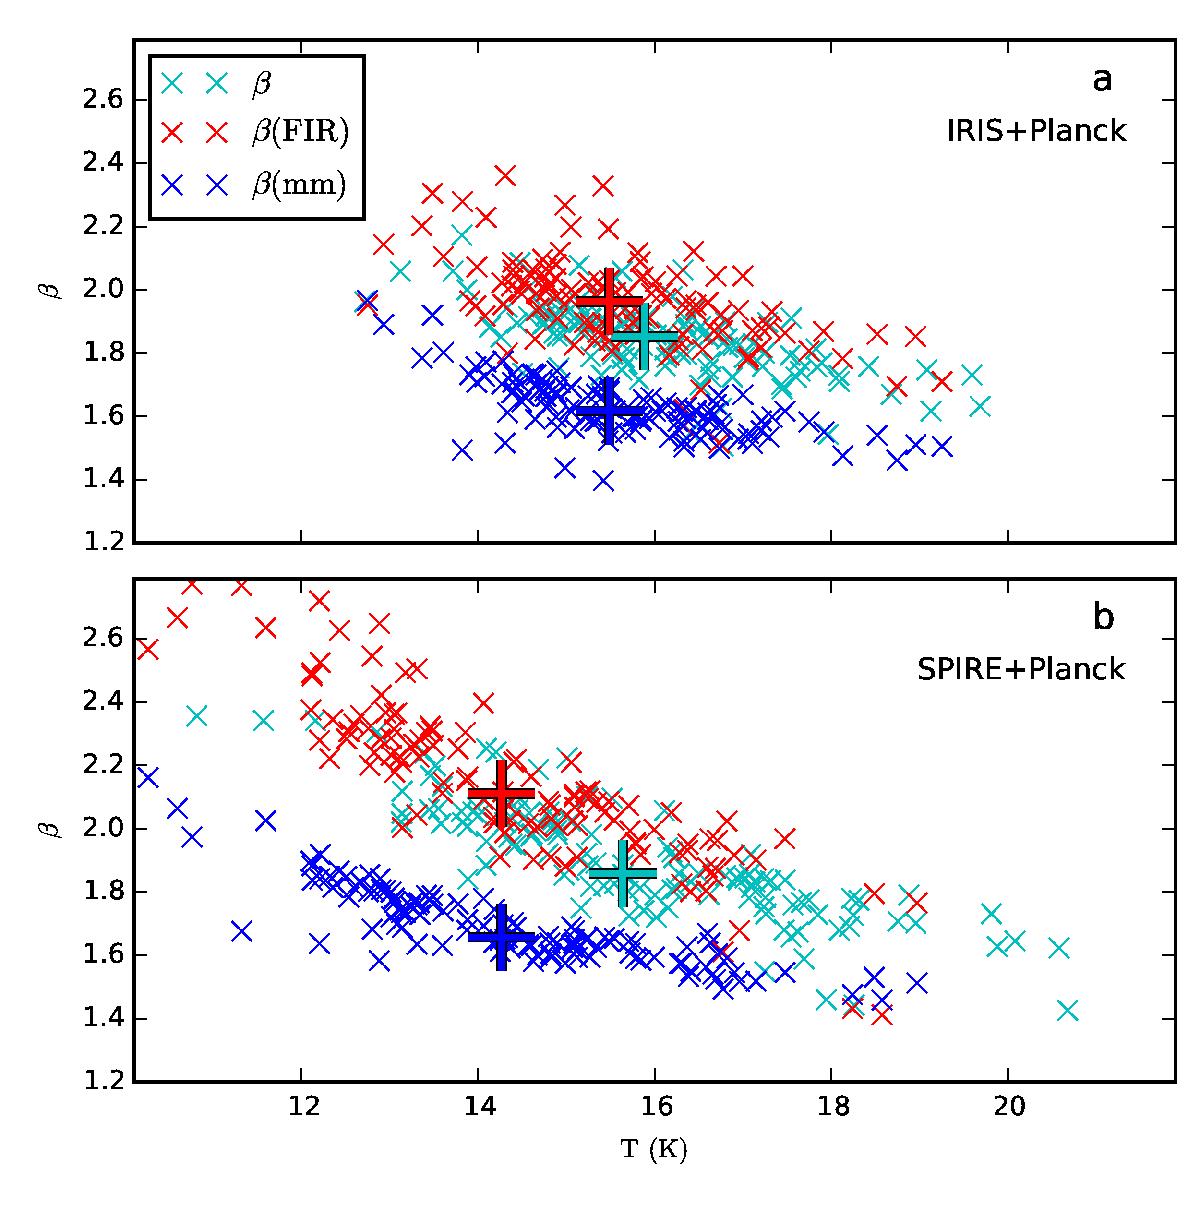
Colour temperature and spectral index fits for surface brightness data averaged over FWHM = 10′ beams centred on each of the 116 fields. The data points correspond to values obtained from an analysis of the IRIS and Planck data (frame a)), and of the SPIRE and Planck data (frame b)). The cyan symbols represent single component fits that are restricted to frequencies ν ≥ 353 GHz. The other plot symbols indicate two component fits that employ different spectral indices below 700 μm (red symbols) and above 700 μm (blue symbols). The Planck 217 GHz band is included in these two component fits. The plus signs indicate median values.
Current usage metrics show cumulative count of Article Views (full-text article views including HTML views, PDF and ePub downloads, according to the available data) and Abstracts Views on Vision4Press platform.
Data correspond to usage on the plateform after 2015. The current usage metrics is available 48-96 hours after online publication and is updated daily on week days.
Initial download of the metrics may take a while.