Fig. D.1
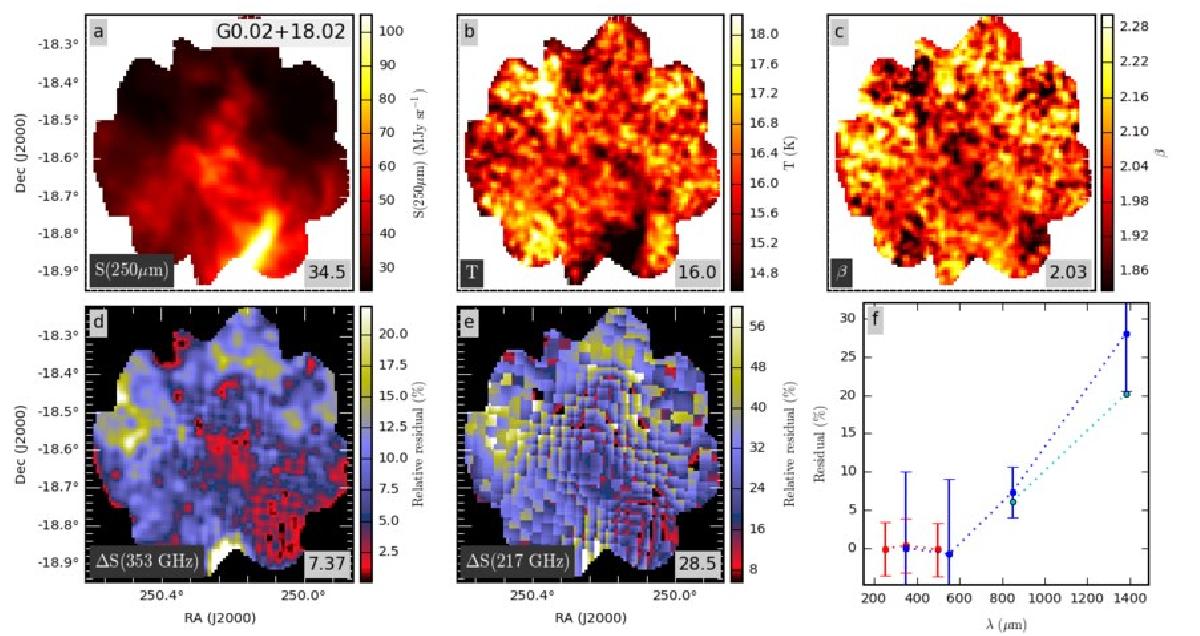
Modified blackbody fits in field G0.02+18.02 using the combination of Herschel and Planck data. The uppermost frames show the fitted intensity at 250 μm, and the colour temperature and spectral index maps. The relative residuals (observation minus model, divided by model prediction) are shown in frames d) and f) for the Planck bands of 353 GHz and 217 GHz. Frame f) shows the median values of the residuals for the three Herschel bands (red symbols) and the four Planck bands (blue symbols). The error bars correspond to the median error estimate of the surface brightness over the map (mainly the assumed calibration errors and the uncertainties of the CO corrections). The lower data points at 850 μm and 1380 μm (Planck bands 353 GHz and 217 GHz; cyan symbols) correspond to twice the default CO correction.
Current usage metrics show cumulative count of Article Views (full-text article views including HTML views, PDF and ePub downloads, according to the available data) and Abstracts Views on Vision4Press platform.
Data correspond to usage on the plateform after 2015. The current usage metrics is available 48-96 hours after online publication and is updated daily on week days.
Initial download of the metrics may take a while.