Fig. 20
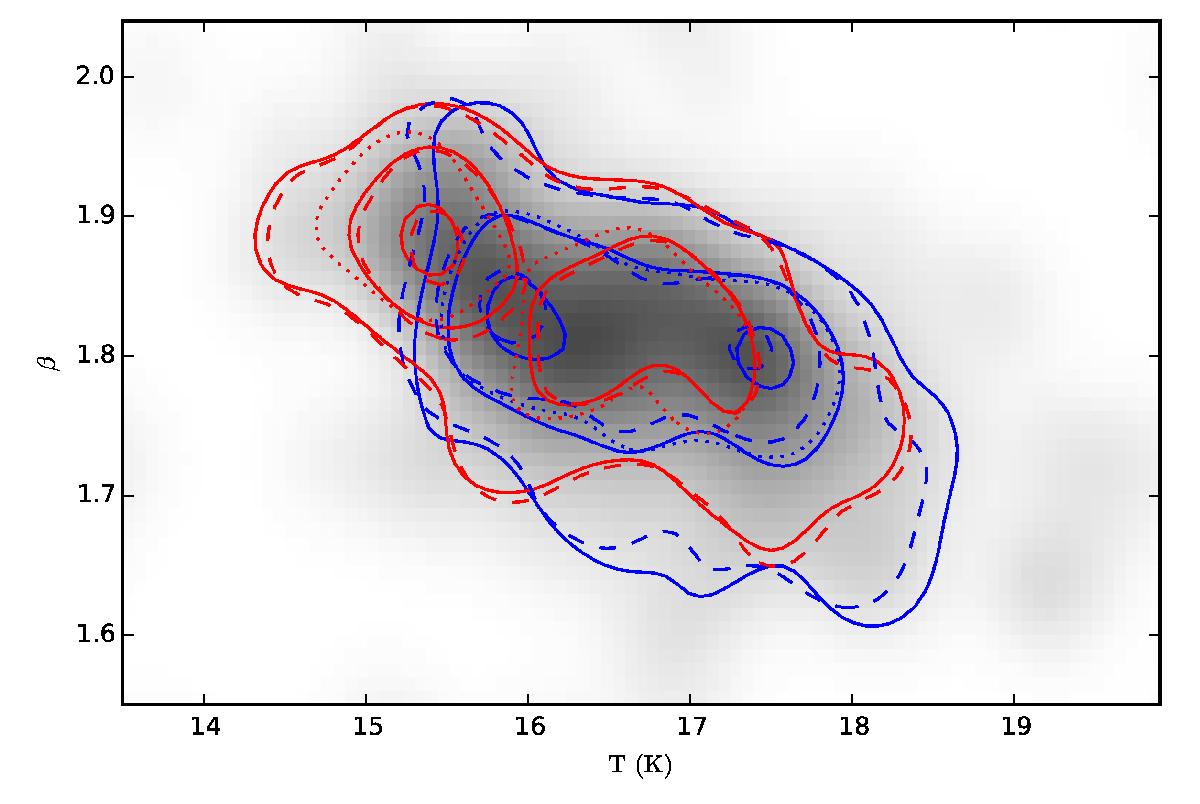
Effect of spatial resolution on field-averaged parameters. The grayscale image shows the distributions of (T, β) values calculated from IRIS and Planck data for pixels. The contours show the distribution separately for pixels below (blue contours) and above (red contours) the average column density in each field. The contours are drawn at levels of 20%, 50%, and 90% of the maximum value (data points per area) for distributions calculated from surface brightness data at 5′ (solid contours) or 10′ (dashed contours) resolution. The dotted contours (50% level only) correspond to a case where the surface brightness values of all pixels below or above the median value (per field) are averaged before (T, β) calculation.
Current usage metrics show cumulative count of Article Views (full-text article views including HTML views, PDF and ePub downloads, according to the available data) and Abstracts Views on Vision4Press platform.
Data correspond to usage on the plateform after 2015. The current usage metrics is available 48-96 hours after online publication and is updated daily on week days.
Initial download of the metrics may take a while.