Fig. 2
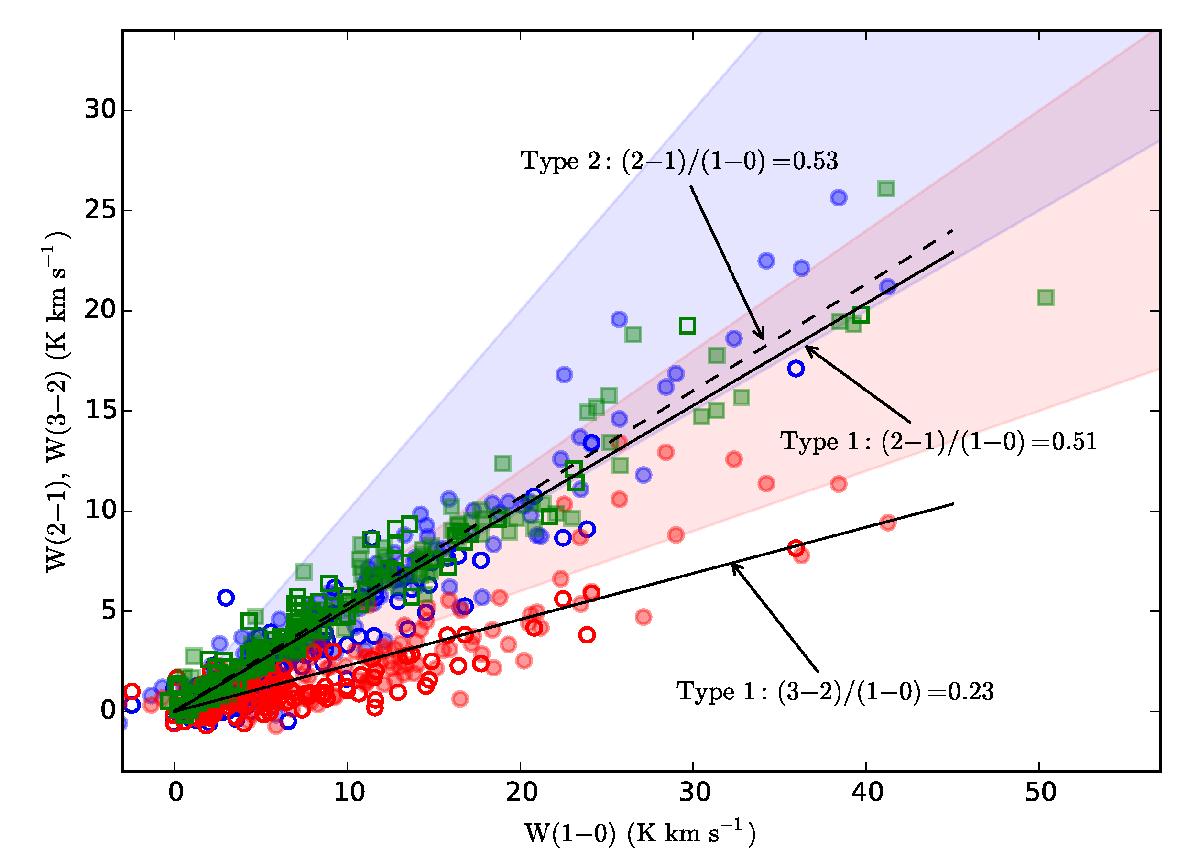
CO line ratios in our fields based on Planck Type 1 and Type 2 CO maps. Type 1 ratios (2–1)/(1–0) and (3–2)/(1–0) are plotted with blue and red circles and Type 2 ratios (2–1)/(1–0) with green squares. The open and the filled symbols are averages over pixels below and above median column density, respectively. The black lines show least squares fits to data including both low and high column densities. The shaded areas indicate the range of line ratios considered in this paper.
Current usage metrics show cumulative count of Article Views (full-text article views including HTML views, PDF and ePub downloads, according to the available data) and Abstracts Views on Vision4Press platform.
Data correspond to usage on the plateform after 2015. The current usage metrics is available 48-96 hours after online publication and is updated daily on week days.
Initial download of the metrics may take a while.