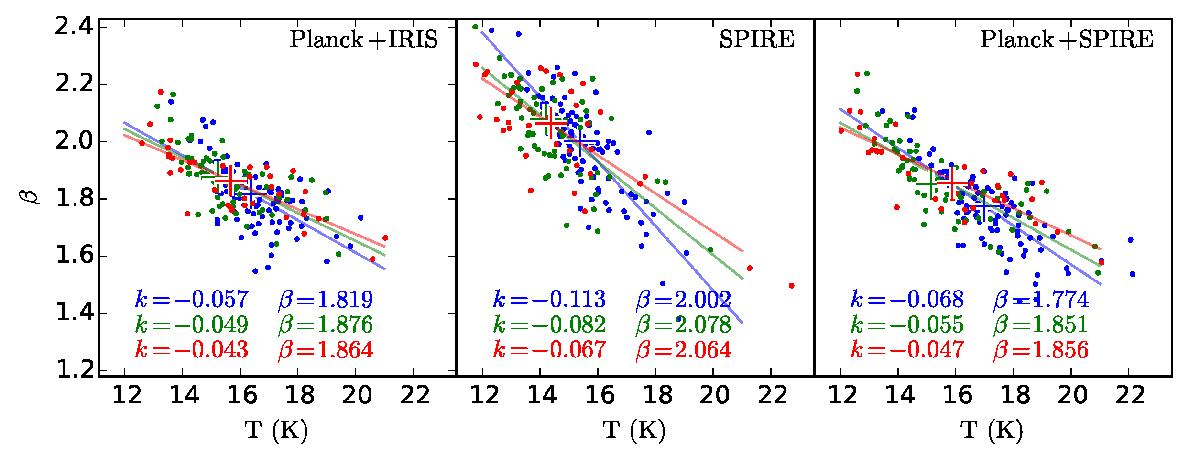
Fig. 19

As previous figures but using average surface brightness values in three τ(250 μm) intervals. The blue, green, and red symbols correspond to τ(250 μm) equal to (1 ± 0.5) × 10-3, (2 ± 0.5) × 10-3, and (3 ± 0.5) × 10-3 respectively. The optical depths are derived from a fit to the SPIRE data using a fixed value of β = 1.8. The lines are least-squares fits to the points of the same colour and the slope values k are listed in the frames (unit K-1). The median values are indicated with crosses (in the middle frame the red and green crosses overlap) and the median values of β are also given.
Current usage metrics show cumulative count of Article Views (full-text article views including HTML views, PDF and ePub downloads, according to the available data) and Abstracts Views on Vision4Press platform.
Data correspond to usage on the plateform after 2015. The current usage metrics is available 48-96 hours after online publication and is updated daily on week days.
Initial download of the metrics may take a while.


