Fig. 18
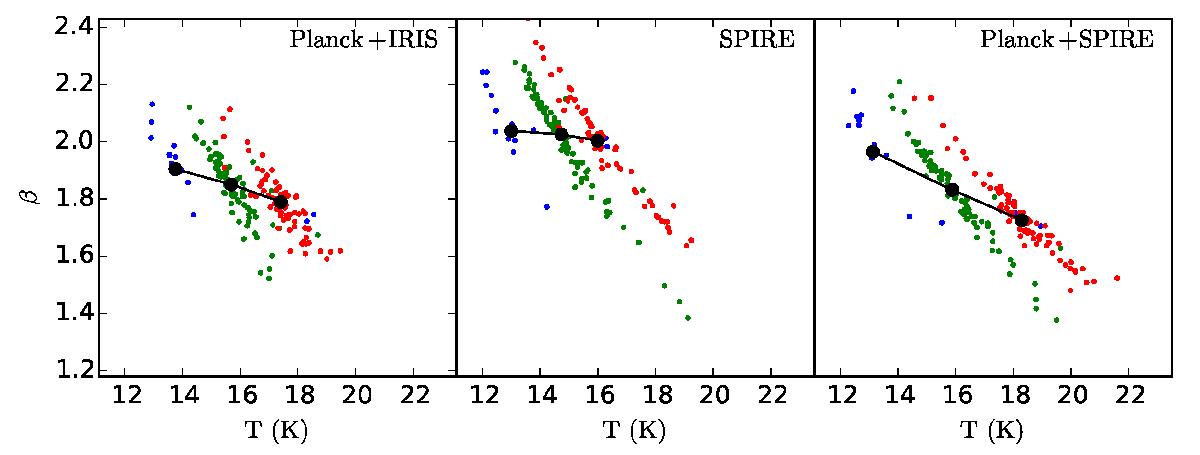
As in Fig. 17 but using the average surface brightness in three temperature intervals that are determined with SPIRE data and a fixed value of the spectral index, β = 1.8. The blue, green, and red symbols correspond to (14 ± 0.5) K, (16 ± 0.5) K, and (18 ± 0.5) K, respectively. Each point corresponds to one field. The black lines connect the median values of the three temperature samples.
Current usage metrics show cumulative count of Article Views (full-text article views including HTML views, PDF and ePub downloads, according to the available data) and Abstracts Views on Vision4Press platform.
Data correspond to usage on the plateform after 2015. The current usage metrics is available 48-96 hours after online publication and is updated daily on week days.
Initial download of the metrics may take a while.