Fig. 14
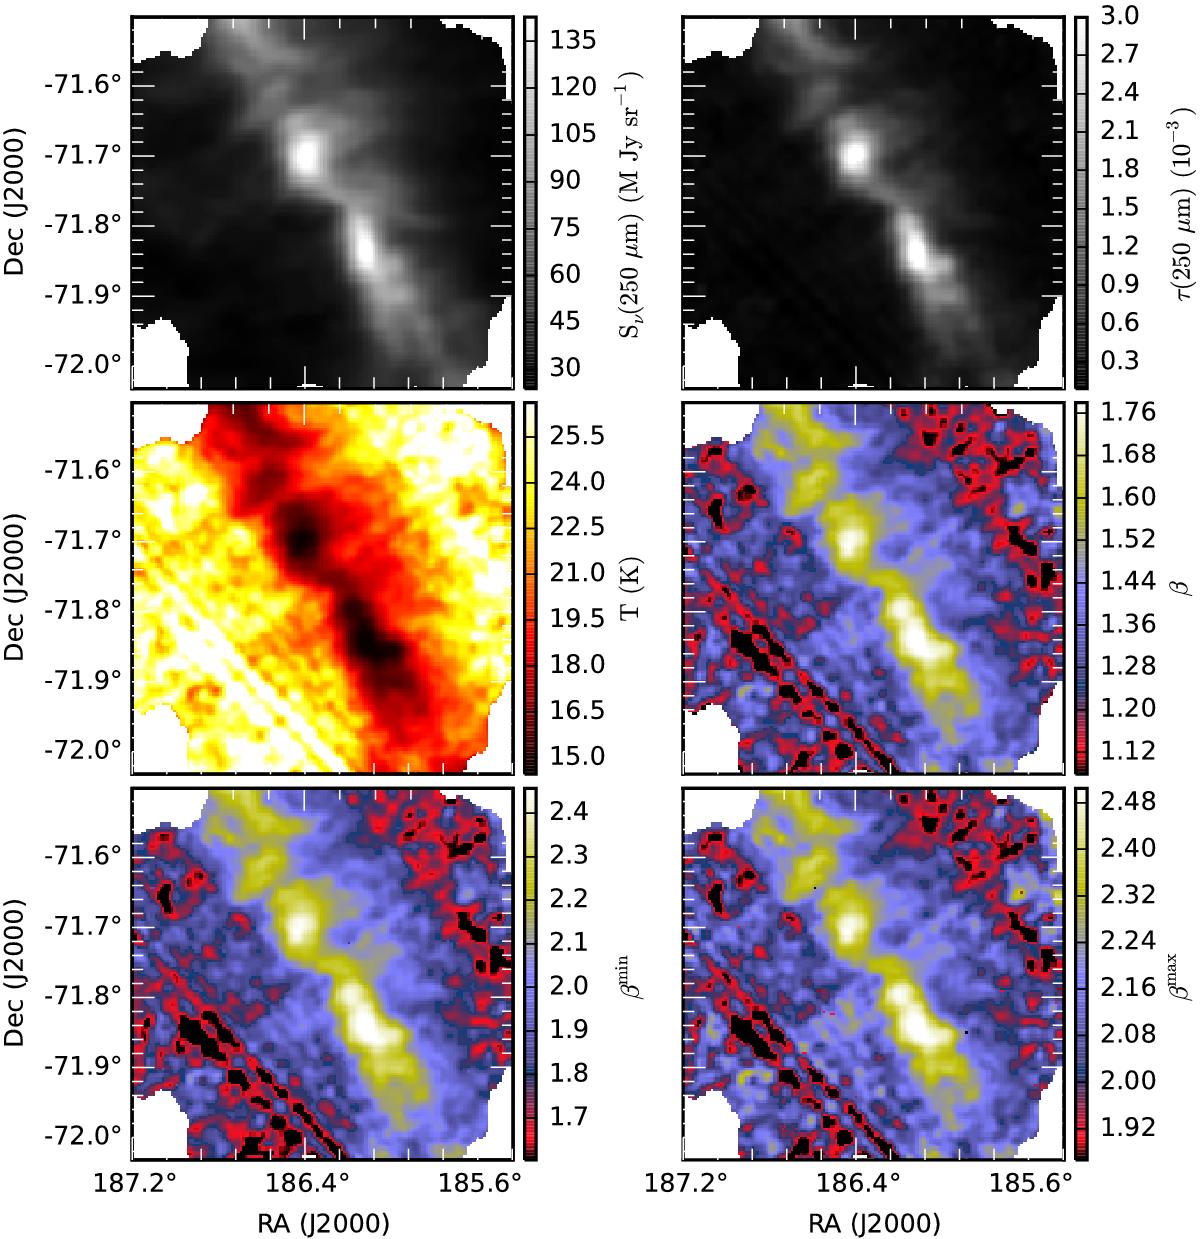
An example of negative correlation between colour temperature and spectral index. The field is G300.86-9.00 in Musca. The frames, as indicated by their colour scales, show 250 μm surface brightness, τ(250 μm) optical depth, colour temperature T, and the spectral index β. The bottom frames show the β maps that correspond to the 16% and 84% percentiles in a Monte Carlo study of zero point errors (see text). The maps are based on SPIRE data and, for plotting only, they have been convolved to a resolution of 1′.
Current usage metrics show cumulative count of Article Views (full-text article views including HTML views, PDF and ePub downloads, according to the available data) and Abstracts Views on Vision4Press platform.
Data correspond to usage on the plateform after 2015. The current usage metrics is available 48-96 hours after online publication and is updated daily on week days.
Initial download of the metrics may take a while.