Free Access
Fig. 1
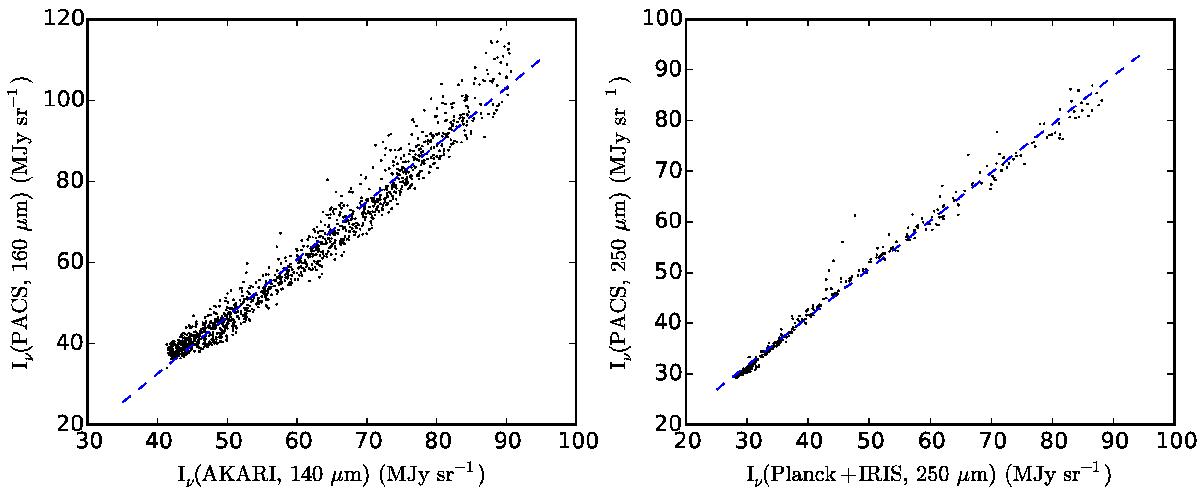
Correlations between Herschel and reference data in the field G300.86-9.00. PACS 160 μm is plotted against AKARI 140 μm data (left frame, 1′ resolution) and SPIRE 250 μm data against interpolated IRIS and Planck data (right frame, 5.0′ resolution).
Current usage metrics show cumulative count of Article Views (full-text article views including HTML views, PDF and ePub downloads, according to the available data) and Abstracts Views on Vision4Press platform.
Data correspond to usage on the plateform after 2015. The current usage metrics is available 48-96 hours after online publication and is updated daily on week days.
Initial download of the metrics may take a while.