Fig. 2
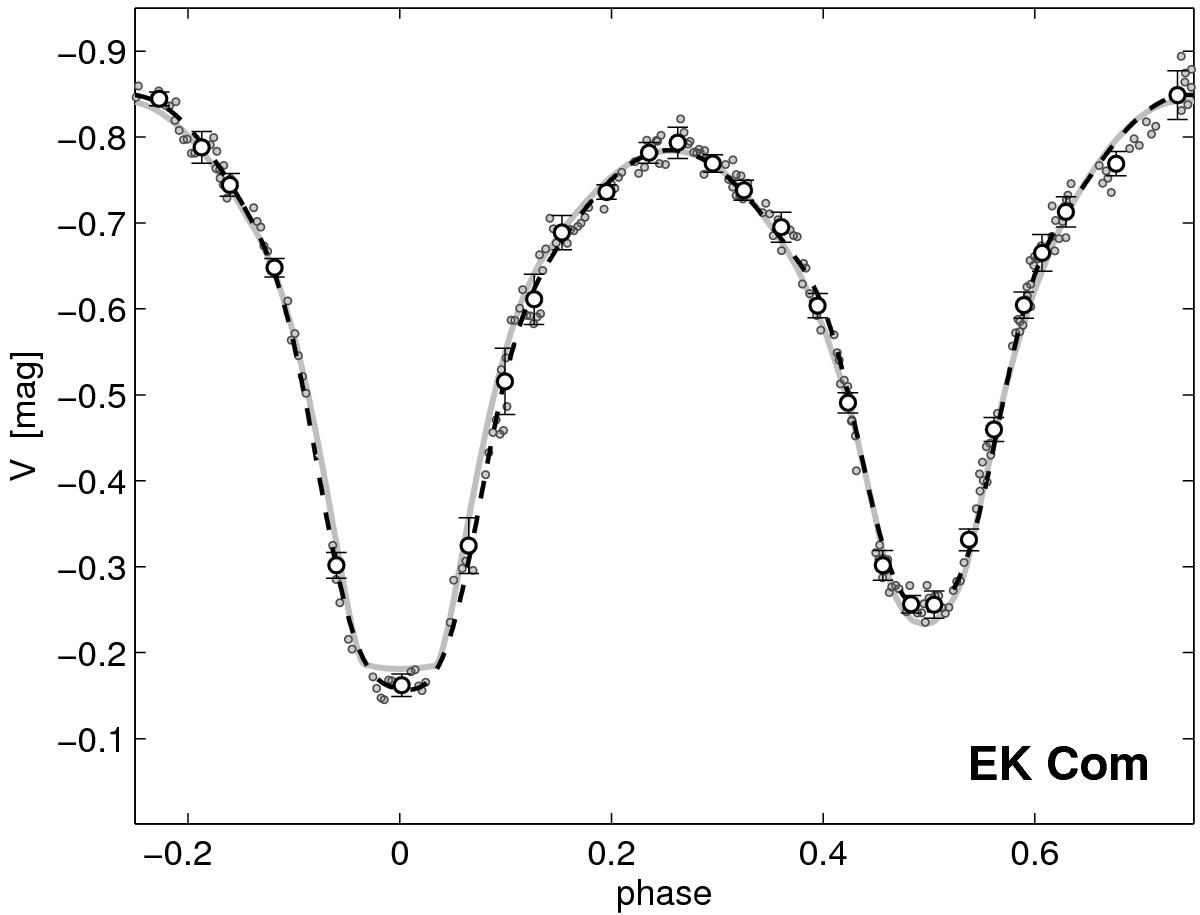
Fit of the V curve of the overcontact spotted EB EK Com (the secondary minimum is a transit). The LC of the close binary is affected by O’Connell and proximity effects. The synthetic model curve is depicted by a solid line, and the phenomenological LC fit is depicted by the dashed line. For more information see Sect. 4.3 and Table 1.
Current usage metrics show cumulative count of Article Views (full-text article views including HTML views, PDF and ePub downloads, according to the available data) and Abstracts Views on Vision4Press platform.
Data correspond to usage on the plateform after 2015. The current usage metrics is available 48-96 hours after online publication and is updated daily on week days.
Initial download of the metrics may take a while.