Fig. 10
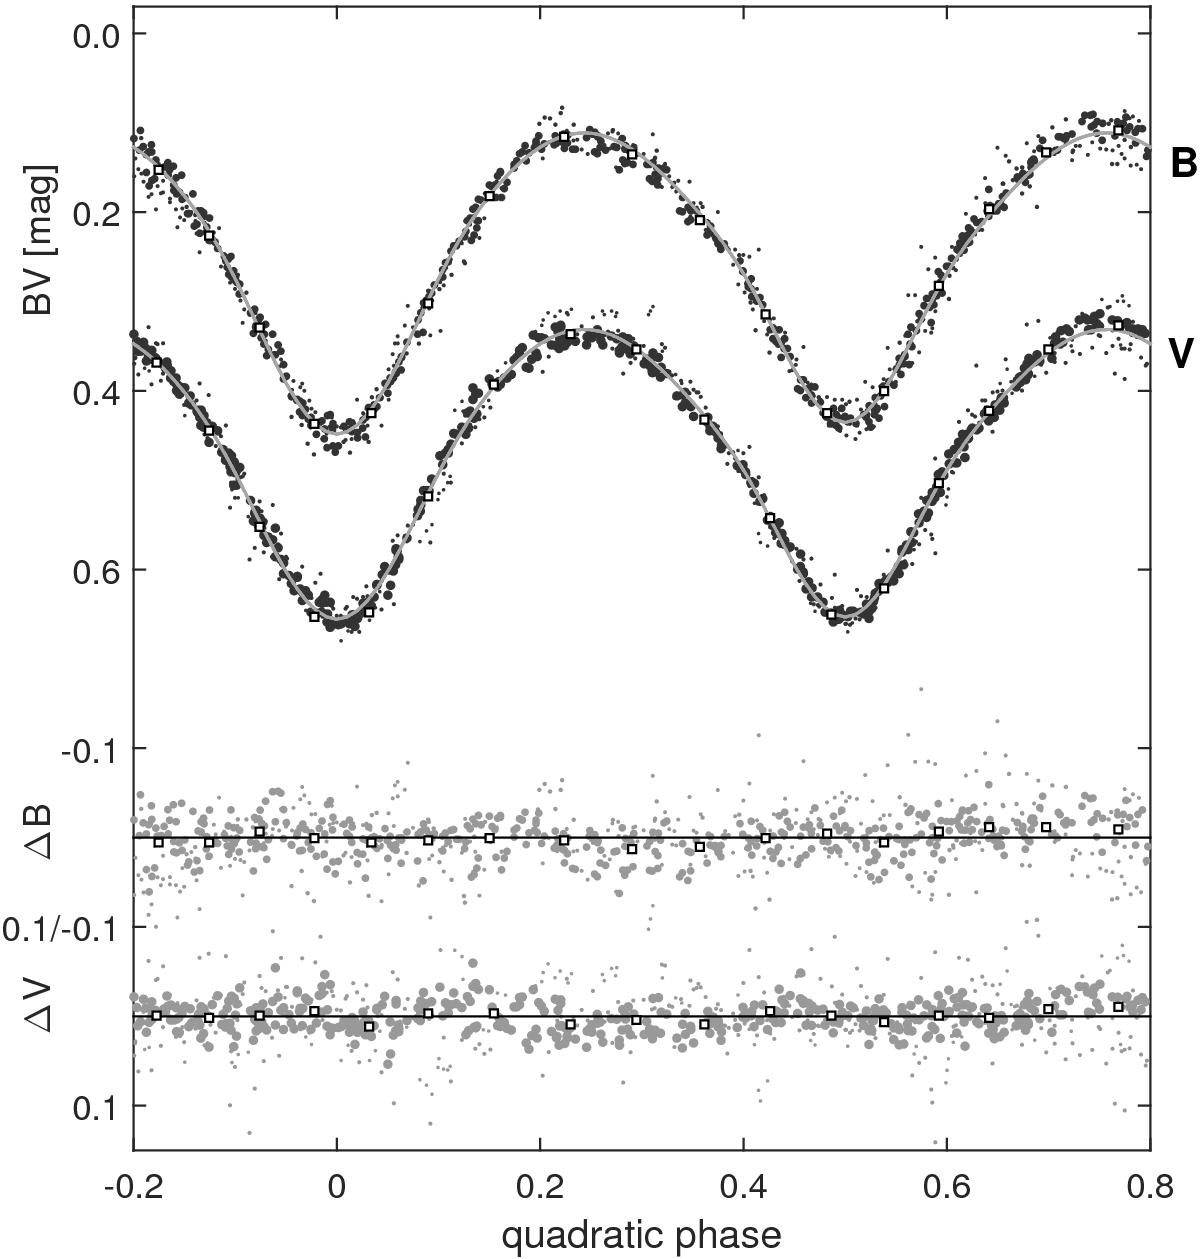
BV curves of XY Boo (see the list in Table 5). The phase is plotted according to our quadratic ephemeris (see Table 4). The areas of points are proportional to their weights. Open squares are normal points, each of which represents the mean of about 50 measurements. Grey lines are fits by our phenomenological model (see Eq. (18) and Table 3). ΔB and ΔV display residuals of BV magnitudes and normal points from the LC phenomenological model. The scale of residuals is two times larger than the measure of BV LCs.
Current usage metrics show cumulative count of Article Views (full-text article views including HTML views, PDF and ePub downloads, according to the available data) and Abstracts Views on Vision4Press platform.
Data correspond to usage on the plateform after 2015. The current usage metrics is available 48-96 hours after online publication and is updated daily on week days.
Initial download of the metrics may take a while.