Fig. 3
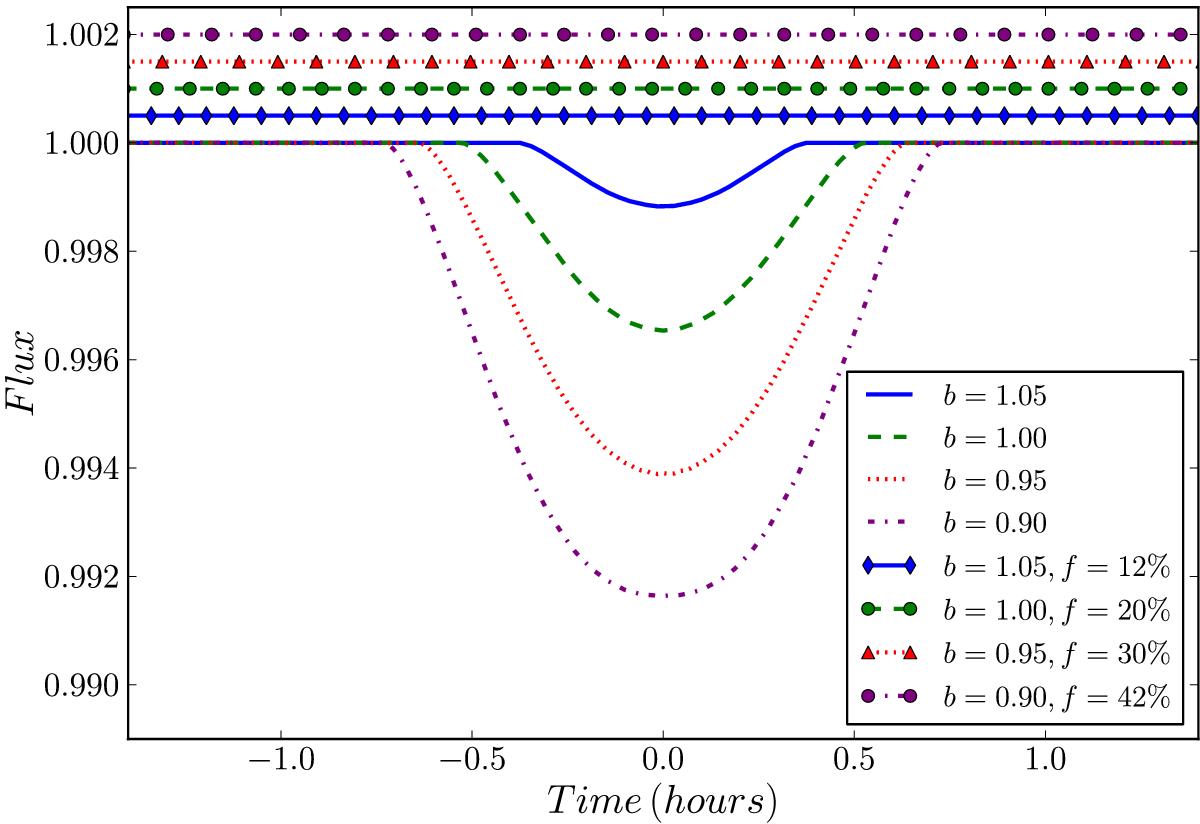
Transit light-curve disappears because of occultation of the grazing transiting planet with polar spots. The transit light-curves are generated with the SOAP-T tool. The lines show that the grazing planet transit light-curves correspond to different impact parameters (b = 0.90,0.95,1.00,1.05) over a star without any spot. The line markers indicate the grazing planets that occult polar spots (centered on the stellar pole) with different filling factors (f). All the spots have a temperature contrast with respect to the stellar temperature of ΔT = 2500 K. The line markers are offset vertically for clarity.
Current usage metrics show cumulative count of Article Views (full-text article views including HTML views, PDF and ePub downloads, according to the available data) and Abstracts Views on Vision4Press platform.
Data correspond to usage on the plateform after 2015. The current usage metrics is available 48-96 hours after online publication and is updated daily on week days.
Initial download of the metrics may take a while.