Fig. 2
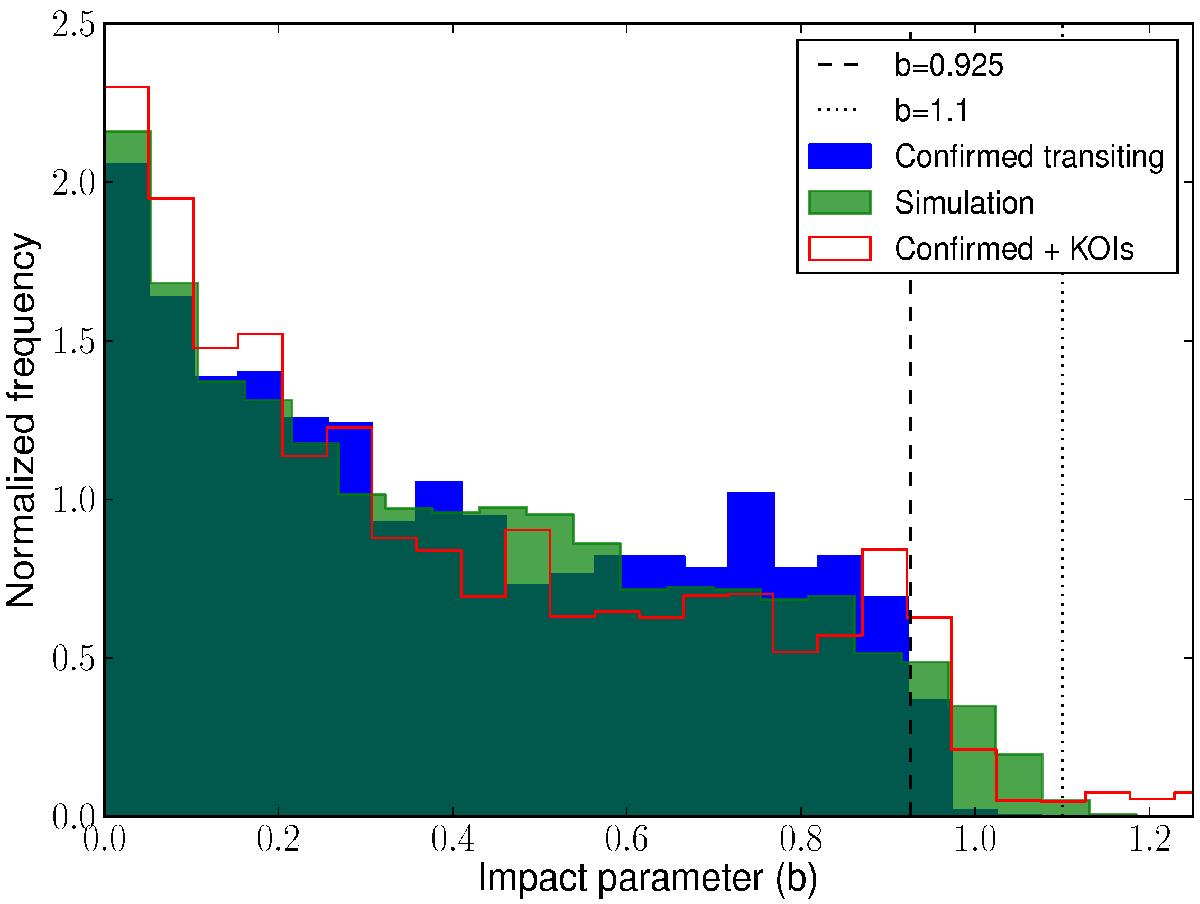
Impact parameter distribution of all confirmed transiting planets (blue histogram). The synthetic impact parameter distribution from our simulation (green histogram). The impact parameter distribution of Kepler planet candidates (KOI)(red histogram). The roughly estimated region of (nearly) grazing planets is shown in the region between the dashed and dotted lines.
Current usage metrics show cumulative count of Article Views (full-text article views including HTML views, PDF and ePub downloads, according to the available data) and Abstracts Views on Vision4Press platform.
Data correspond to usage on the plateform after 2015. The current usage metrics is available 48-96 hours after online publication and is updated daily on week days.
Initial download of the metrics may take a while.