Fig. 1
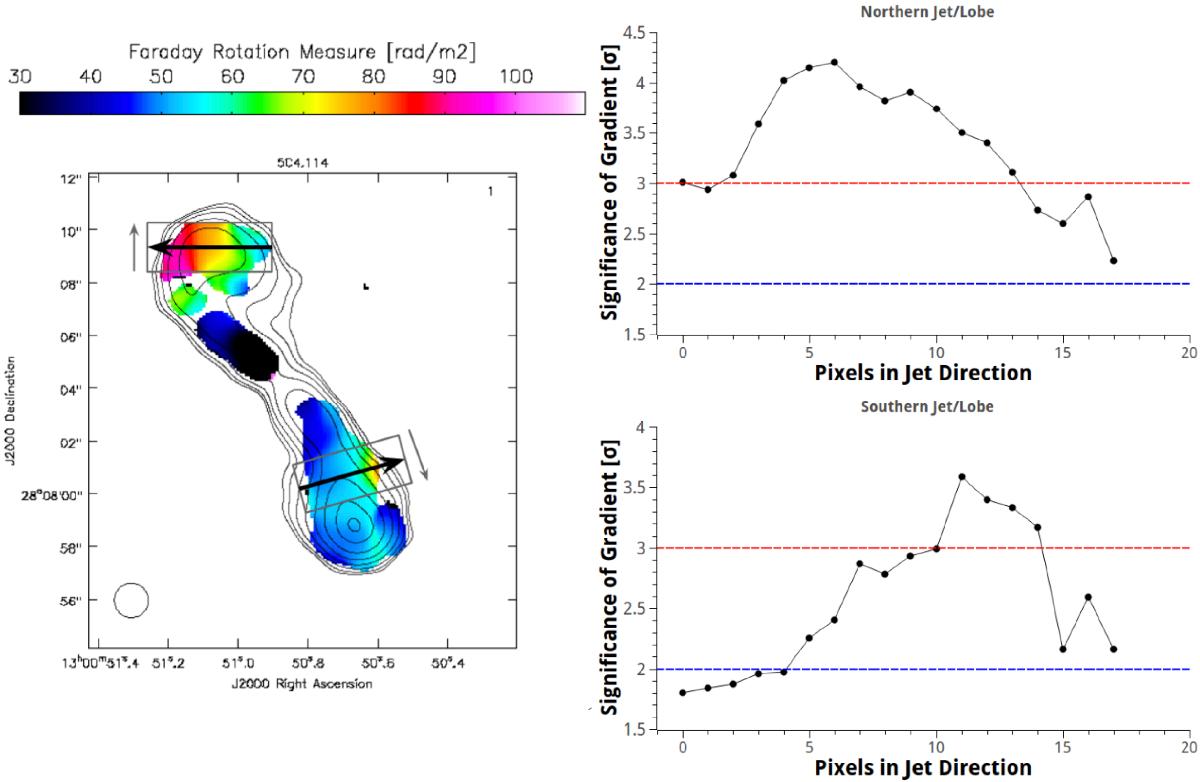
Left: 4.9-GHz intensity map of the 5C 4.114 with the RM distribution superposed. The intensity peak is 3.6 mJy/beam, the lowest intensity contour is 5.0 × 10⁻² mJy/beam, and the contours increase in increments of a factor of two. The two black arrows highlight transverse RM gradients visible across the northern lobe and the southern jet/lobe. The grey boxes show the regions for which the significances of series of parallel, monotonic transverse RM gradients are plotted in the right-hand panels; the grey arrows pointing outward along the jet show the direction of increasing pixel number in the right panels, and pixel 0 corresponds to the inner edge of each of the grey boxes. The pixel size is 0.1 arcsec. The 2σ level is shown by the dashed blue horizontal lines, and the 3σ level by the dashed red horizontal lines.
Current usage metrics show cumulative count of Article Views (full-text article views including HTML views, PDF and ePub downloads, according to the available data) and Abstracts Views on Vision4Press platform.
Data correspond to usage on the plateform after 2015. The current usage metrics is available 48-96 hours after online publication and is updated daily on week days.
Initial download of the metrics may take a while.