Fig. 2
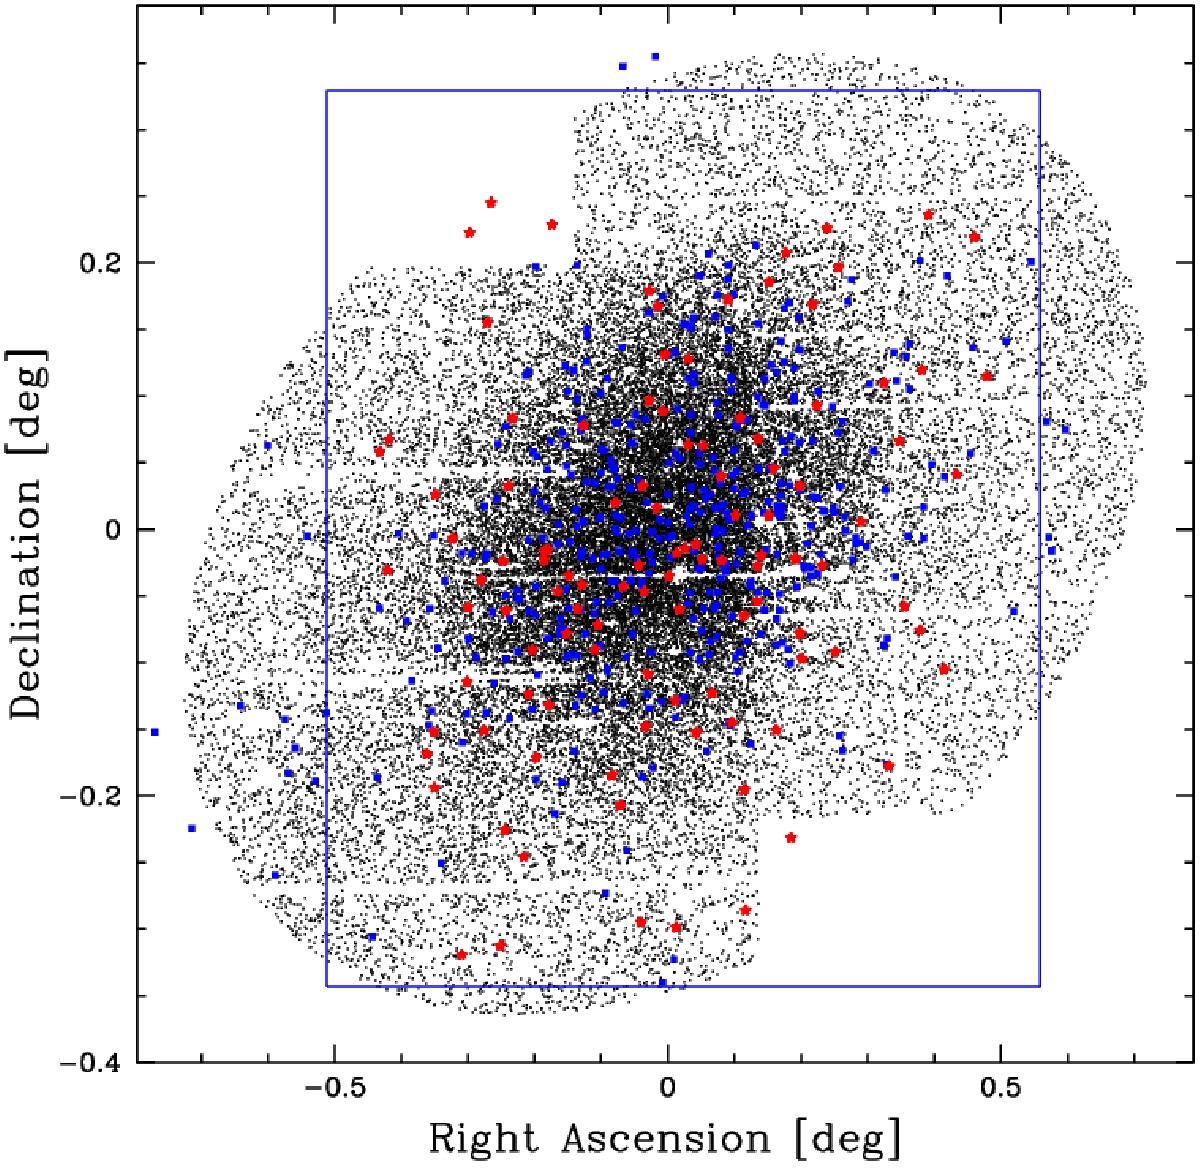
Carina dSph. Comparison between the different fields of our data set. The black dots represent stars in the de Boer et al. (2014) photometric catalogue inside one tidal radius. The blue rectangle is the field of the Bono et al. (2010) catalogue. The red stars mark the position of RR Lyrae stars, while the blue squares are the stars with spectroscopic measurements (Helmi et al. 2006). The zero point of the horizontal and vertical axes is set to RA = 6h 41m 36.6s and Dec =−50°57′58′′ (J2000).
Current usage metrics show cumulative count of Article Views (full-text article views including HTML views, PDF and ePub downloads, according to the available data) and Abstracts Views on Vision4Press platform.
Data correspond to usage on the plateform after 2015. The current usage metrics is available 48-96 hours after online publication and is updated daily on week days.
Initial download of the metrics may take a while.