Fig. 11
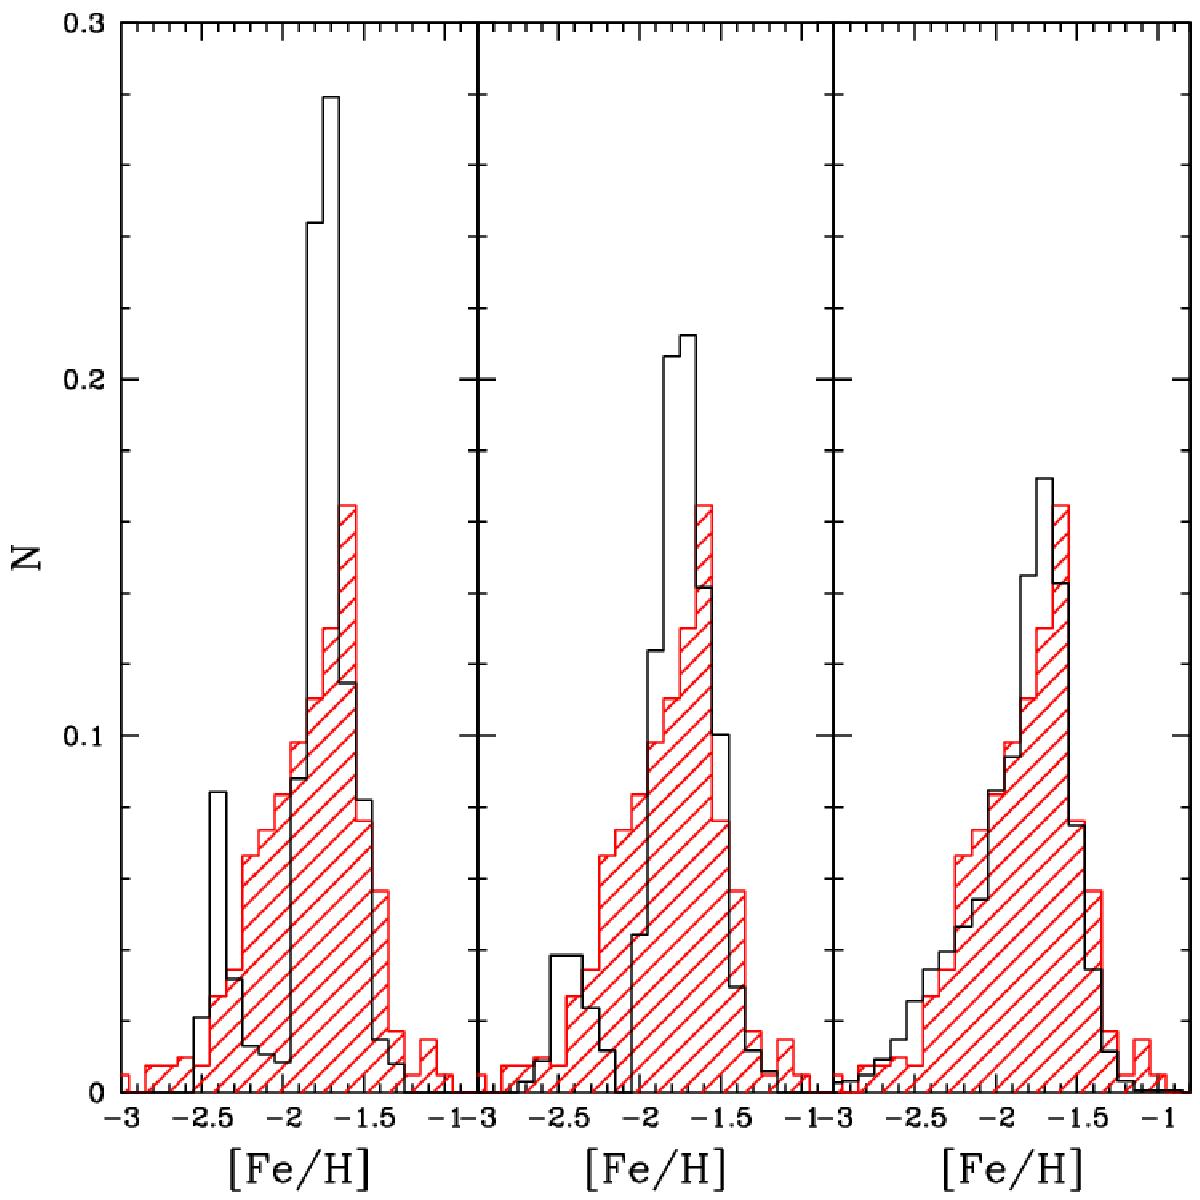
Left panel: normalized MDF from red giant stars. The black histogram shows the MDF inferred from our toy model. The red shaded histogram represents the empirical distribution determined by Helmi et al. (2006) and employed by dB14. Central panel: as for the right panel, but with the inclusion of intrinsic measurement errors in our MDF. Right panel: as for the central panel, but also taking into account the observed spread in the [Ca/Fe] values of Carina stars (see text for details).
Current usage metrics show cumulative count of Article Views (full-text article views including HTML views, PDF and ePub downloads, according to the available data) and Abstracts Views on Vision4Press platform.
Data correspond to usage on the plateform after 2015. The current usage metrics is available 48-96 hours after online publication and is updated daily on week days.
Initial download of the metrics may take a while.