Fig. 3
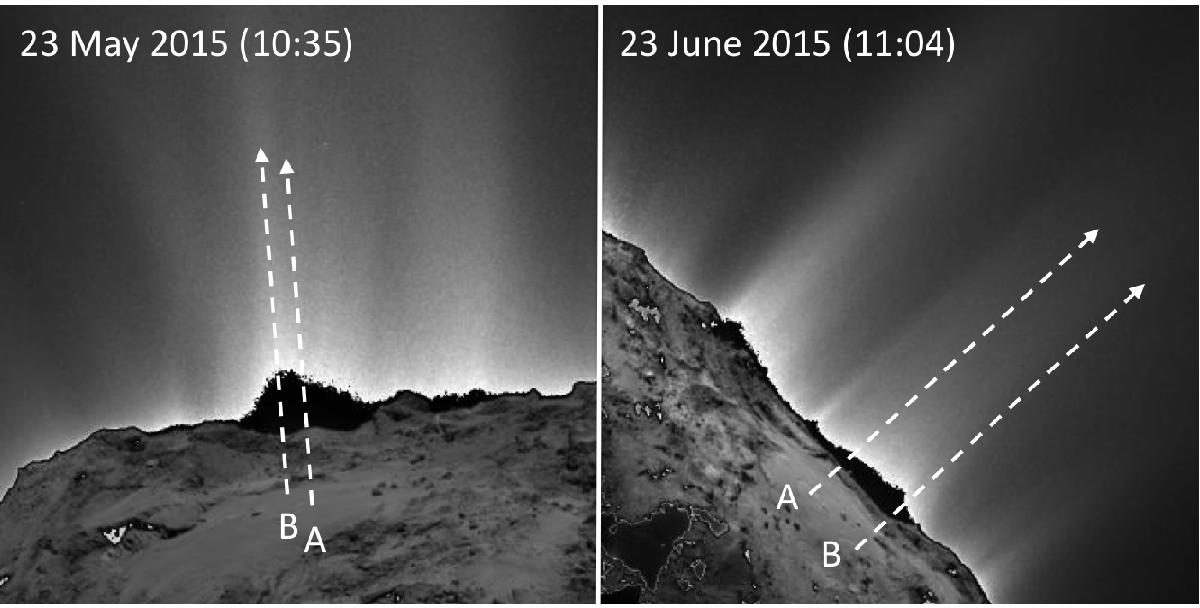
Activity above Imhotep on 23 May 2015 and 23 June 2015 (UT), before and after the changes started. The local time at the nucleus differs by less than 30 min between the two images. The white arrows indicate the position where we would expect an increase in activity if jets were emitted from features A or B. The images were acquired with the NAC, more than 50° away from nadir.
Current usage metrics show cumulative count of Article Views (full-text article views including HTML views, PDF and ePub downloads, according to the available data) and Abstracts Views on Vision4Press platform.
Data correspond to usage on the plateform after 2015. The current usage metrics is available 48-96 hours after online publication and is updated daily on week days.
Initial download of the metrics may take a while.