Fig. 9
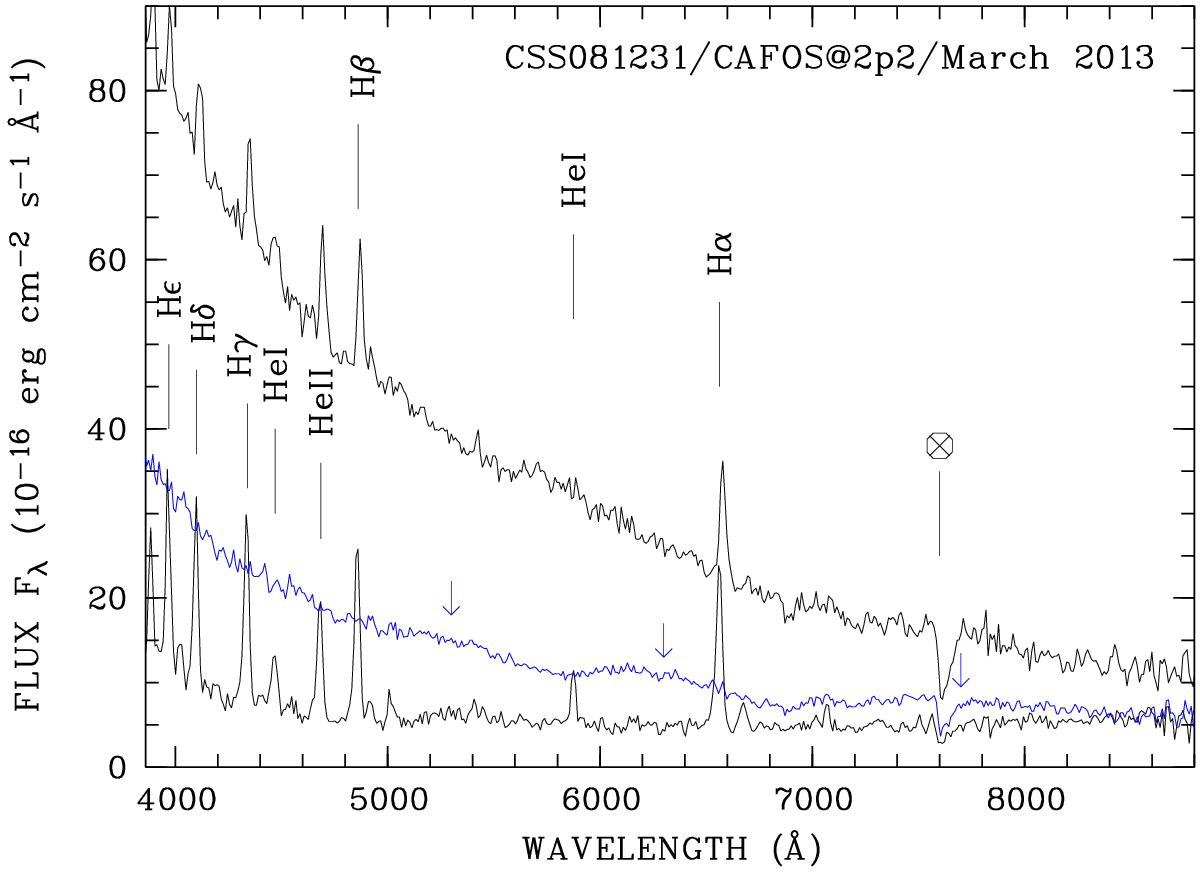
CAFOS spectra obtained during bright (φ = 0.92−0.95) and faint phases (φ = 0.31−0.37) a few weeks prior to Obs2. The spectrum displayed in blue was obtained at phase 0.18 with atomic emission lines subtracted. It shows modulations that were identified with cyclotron harmonics indicated by arrows. Hydrogen Balmer, HeI, and HeII lines are prominent. The feature indicated with a cross is an atmospheric line; the spectra have not been corrected for them.
Current usage metrics show cumulative count of Article Views (full-text article views including HTML views, PDF and ePub downloads, according to the available data) and Abstracts Views on Vision4Press platform.
Data correspond to usage on the plateform after 2015. The current usage metrics is available 48-96 hours after online publication and is updated daily on week days.
Initial download of the metrics may take a while.