Fig. 2
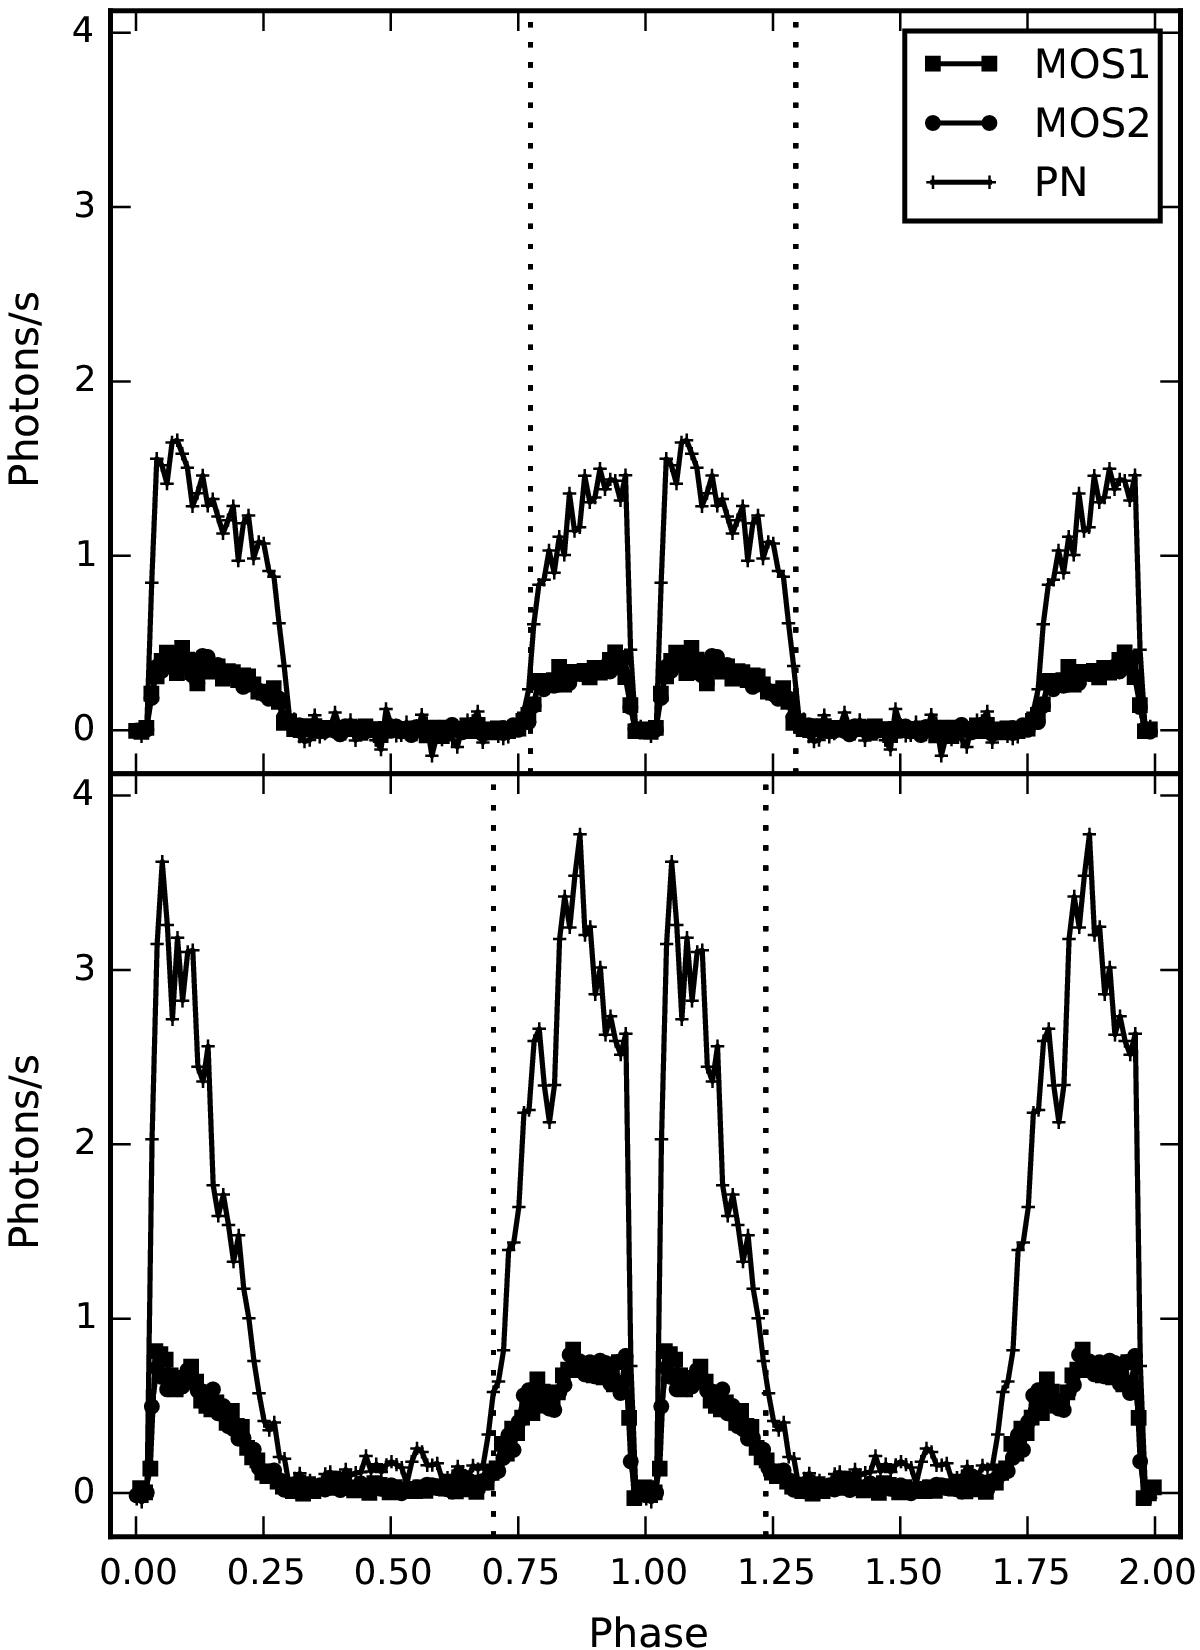
Phase-folded X-ray light curves of J071126 in both observations, for the EPIC-MOS1, MOS2, and pn instruments. The light curves have been binned into 100 bins per cycle, and two phases are plotted for clarity. The energy ranges are 0.2–12 keV for the EPIC-MOS instruments and 0.2–15 keV for EPIC-pn, and count rates have been corrected for the enclosed count fraction of the source extraction regions. Dotted vertical lines indicate the beginning and end of the bright phase, clearly showing the longitudinal shift.
Current usage metrics show cumulative count of Article Views (full-text article views including HTML views, PDF and ePub downloads, according to the available data) and Abstracts Views on Vision4Press platform.
Data correspond to usage on the plateform after 2015. The current usage metrics is available 48-96 hours after online publication and is updated daily on week days.
Initial download of the metrics may take a while.