Fig. 14
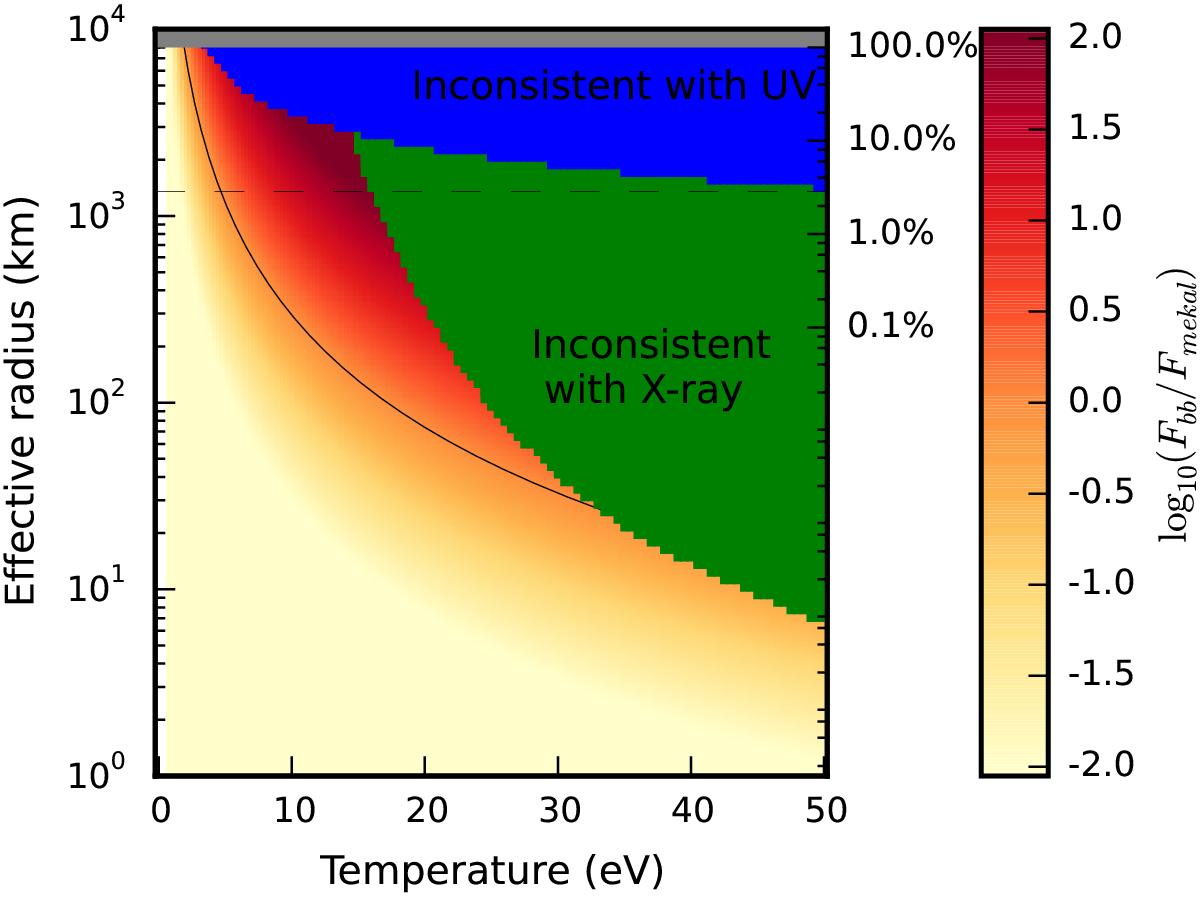
Parameter space in which a soft excess can exist. The blue and green regions indicate areas excluded because they are not consistent with the XMM-Newton OM or X-ray observations, and the grey region indicates an emitting area larger than the 8000 km WD. Shaded points show the flux of the corresponding blackbody divided by the flux of the Mekal component, and the black line tracks blackbodies with Fbb = Fmekal. The wedge-shaped region above the black line represents the area of the parameter space where a soft excess is still consistent with XMM-Newton observations. The dashed horizontal line represents a circular spot with an eclipse ingress time of 10 s, the largest still consistent with the UVM2 ingress. The right y-axis expresses the emitting area as a percentage of the WD surface.
Current usage metrics show cumulative count of Article Views (full-text article views including HTML views, PDF and ePub downloads, according to the available data) and Abstracts Views on Vision4Press platform.
Data correspond to usage on the plateform after 2015. The current usage metrics is available 48-96 hours after online publication and is updated daily on week days.
Initial download of the metrics may take a while.