Free Access
Fig. 11
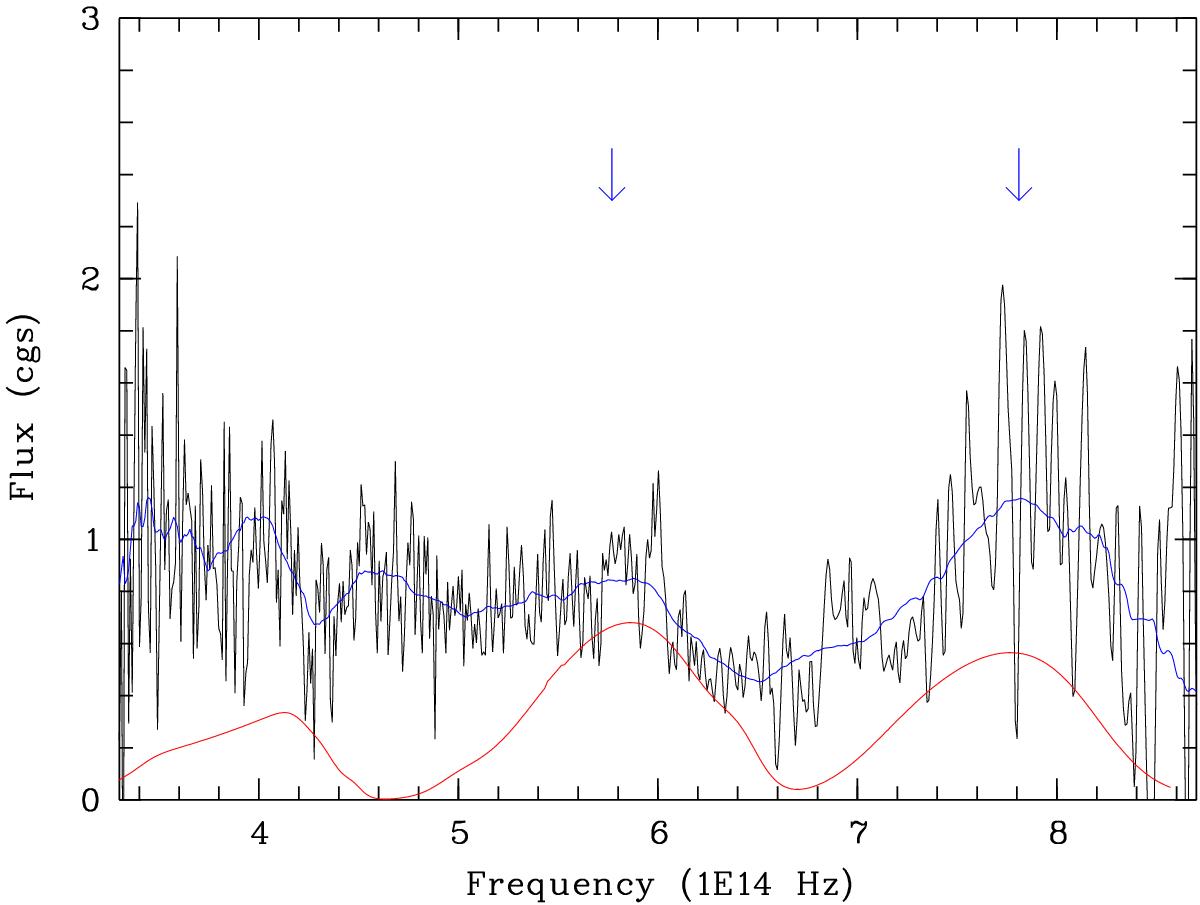
Mean faint phase spectrum (φ = 0.38−0.60) after subtracting atomic emission lines and the mean spectrum of the phase interval 0.31−0.37. The blue line is a boxcar-smoothed version of the same data. The arrows indicate tentatively identified cyclotron harmonics. The red line is a 3 keV cyclotron model from a 69 MG field.
Current usage metrics show cumulative count of Article Views (full-text article views including HTML views, PDF and ePub downloads, according to the available data) and Abstracts Views on Vision4Press platform.
Data correspond to usage on the plateform after 2015. The current usage metrics is available 48-96 hours after online publication and is updated daily on week days.
Initial download of the metrics may take a while.