Fig. 5
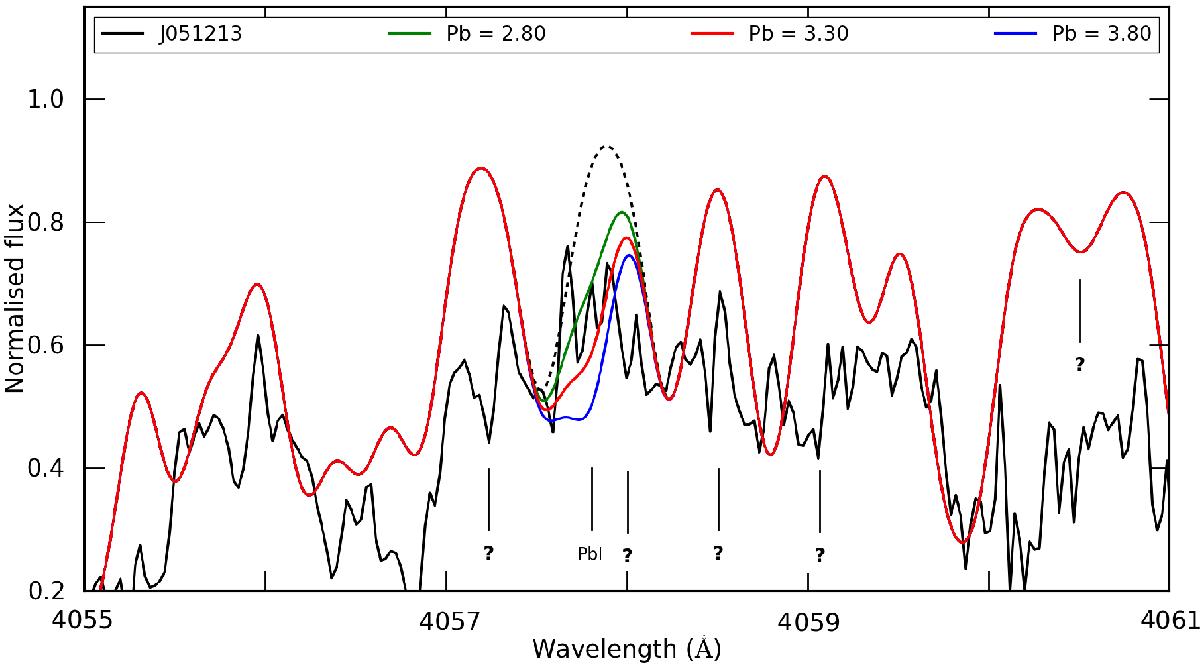
Spectrum synthesis of the Pb I line at 4057.807 Å for J051213. The black spectrum is the observed spectrum of J051213, the coloured spectra represent synthetic spectra with different Pb abundances. The dashed black line shows the synthetic spectrum if no Pb is present. Positions of unidentified spectral lines are indicated by question marks. For more information, see text.
Current usage metrics show cumulative count of Article Views (full-text article views including HTML views, PDF and ePub downloads, according to the available data) and Abstracts Views on Vision4Press platform.
Data correspond to usage on the plateform after 2015. The current usage metrics is available 48-96 hours after online publication and is updated daily on week days.
Initial download of the metrics may take a while.