Fig. 14
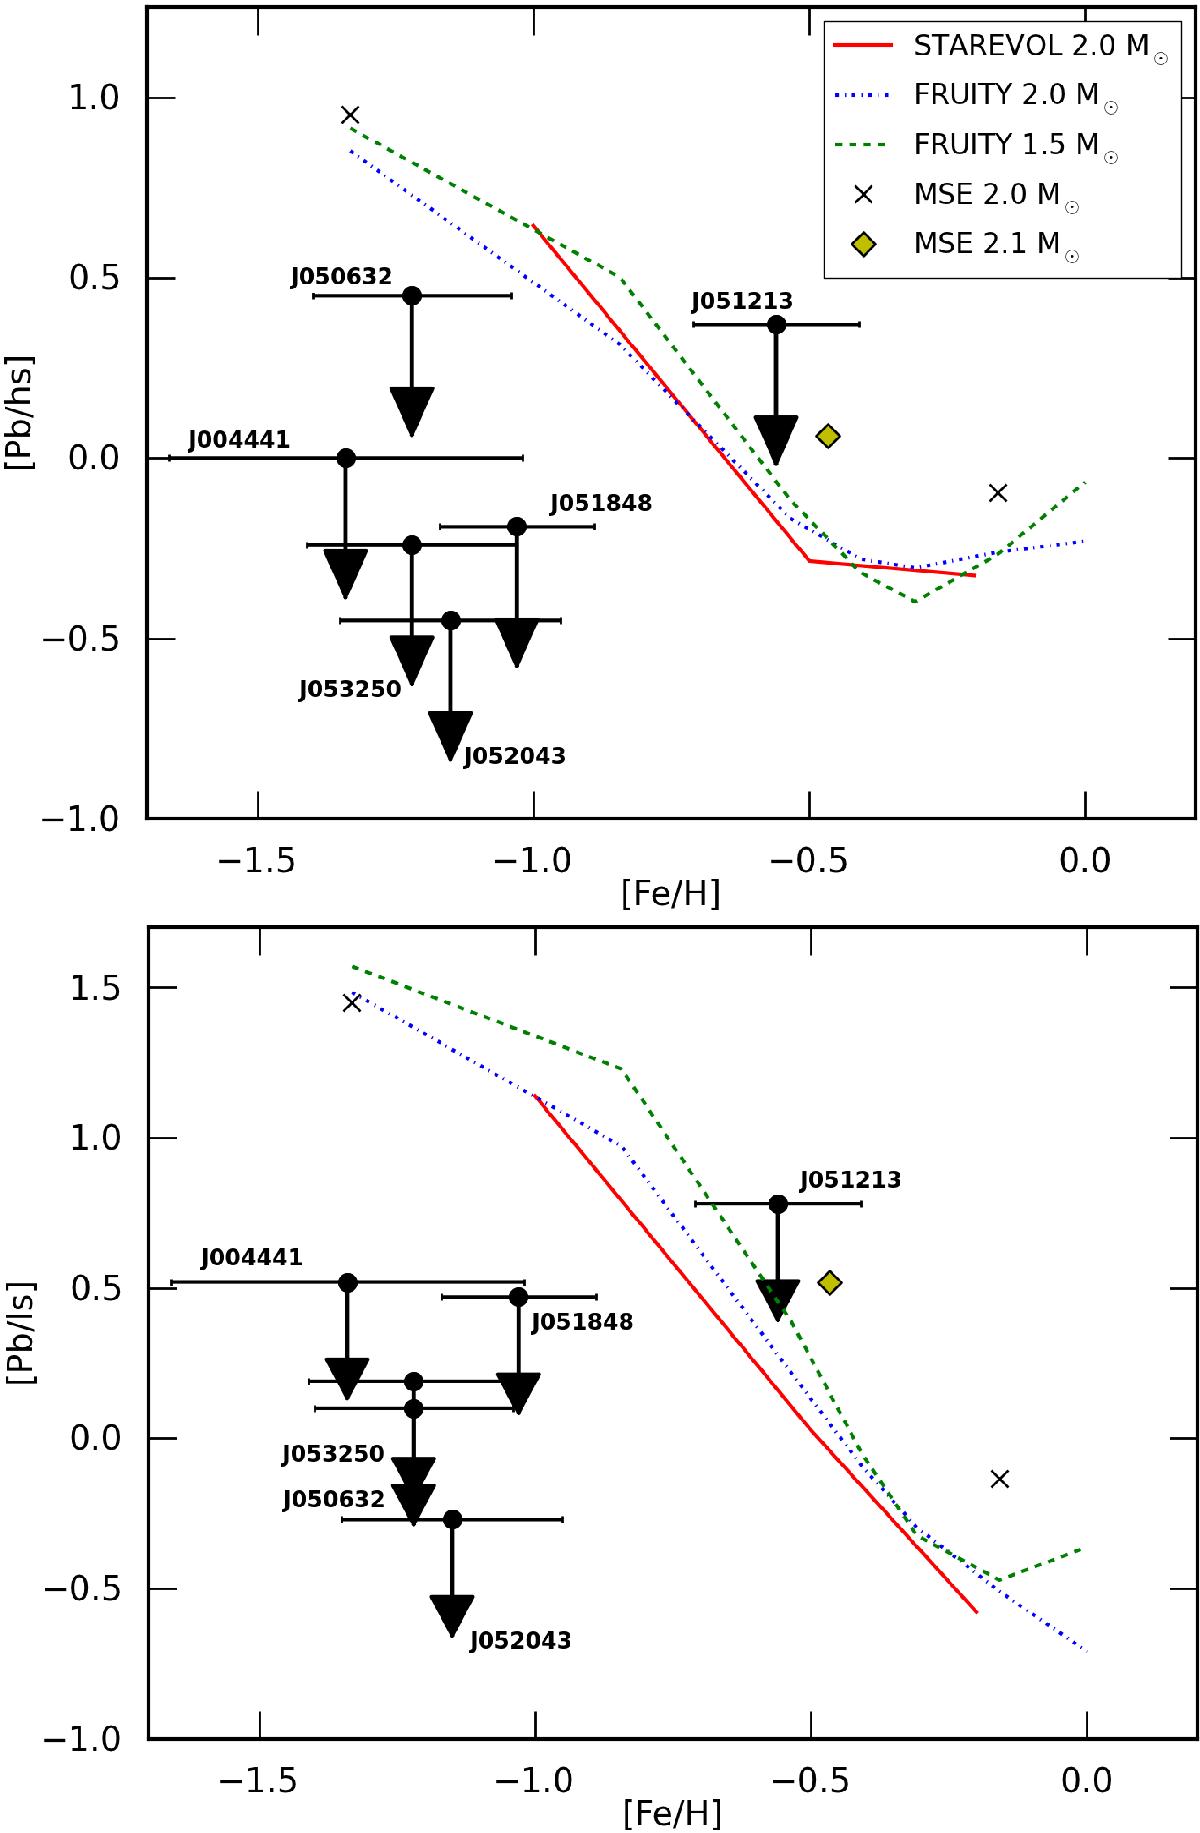
Overview of the observed [Pb/hs] (upper panel) and [Pb/ls] (lower panel) upper limits of s-process enriched post-AGB stars in the Magellanic Clouds from this study and De Smedt et al. (2014). The observed abundance upper limits are plotted together with the [Pb/hs] and [Pb/ls] predictions of the 2.0 M⊙ STAREVOL models (red full line),the 2.0 M⊙ and 2.1 M⊙ Mount Stromlo models (black crosses and yellow diamond, respectively) and the 1.5 and 2.0 M⊙ FRUITY models (green dashed and blue dot-dashed lines, respectively). The black horizontal lines represent the [Fe/H] uncertainty of the stars shown. The position of each star is indicated with the first part of its 2MASS name. For more information, see text.
Current usage metrics show cumulative count of Article Views (full-text article views including HTML views, PDF and ePub downloads, according to the available data) and Abstracts Views on Vision4Press platform.
Data correspond to usage on the plateform after 2015. The current usage metrics is available 48-96 hours after online publication and is updated daily on week days.
Initial download of the metrics may take a while.