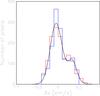
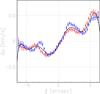
Fig. 13

Left: distributions of the mean Doppler velocity Δv (km s-1) measured with respect to its value averaged over the whole map (shown as “reference” in Fig. 12). The black curve shows a two-Gaussian common fit to the two distributions. Right: dependence of the projection of the mean Doppler velocity Δv (km s-1), averaged over pixels, included in the bands shown in Fig. 14, on coordinate ξ measured from south-east to north-west. The black curve shows a polynomial common fit to the two distributions. In both panels, the CO(1−0) data are shown in red and the CO(2−1) data in blue.
Current usage metrics show cumulative count of Article Views (full-text article views including HTML views, PDF and ePub downloads, according to the available data) and Abstracts Views on Vision4Press platform.
Data correspond to usage on the plateform after 2015. The current usage metrics is available 48-96 hours after online publication and is updated daily on week days.
Initial download of the metrics may take a while.