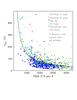
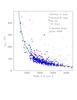
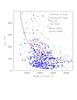
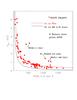
Fig. 5
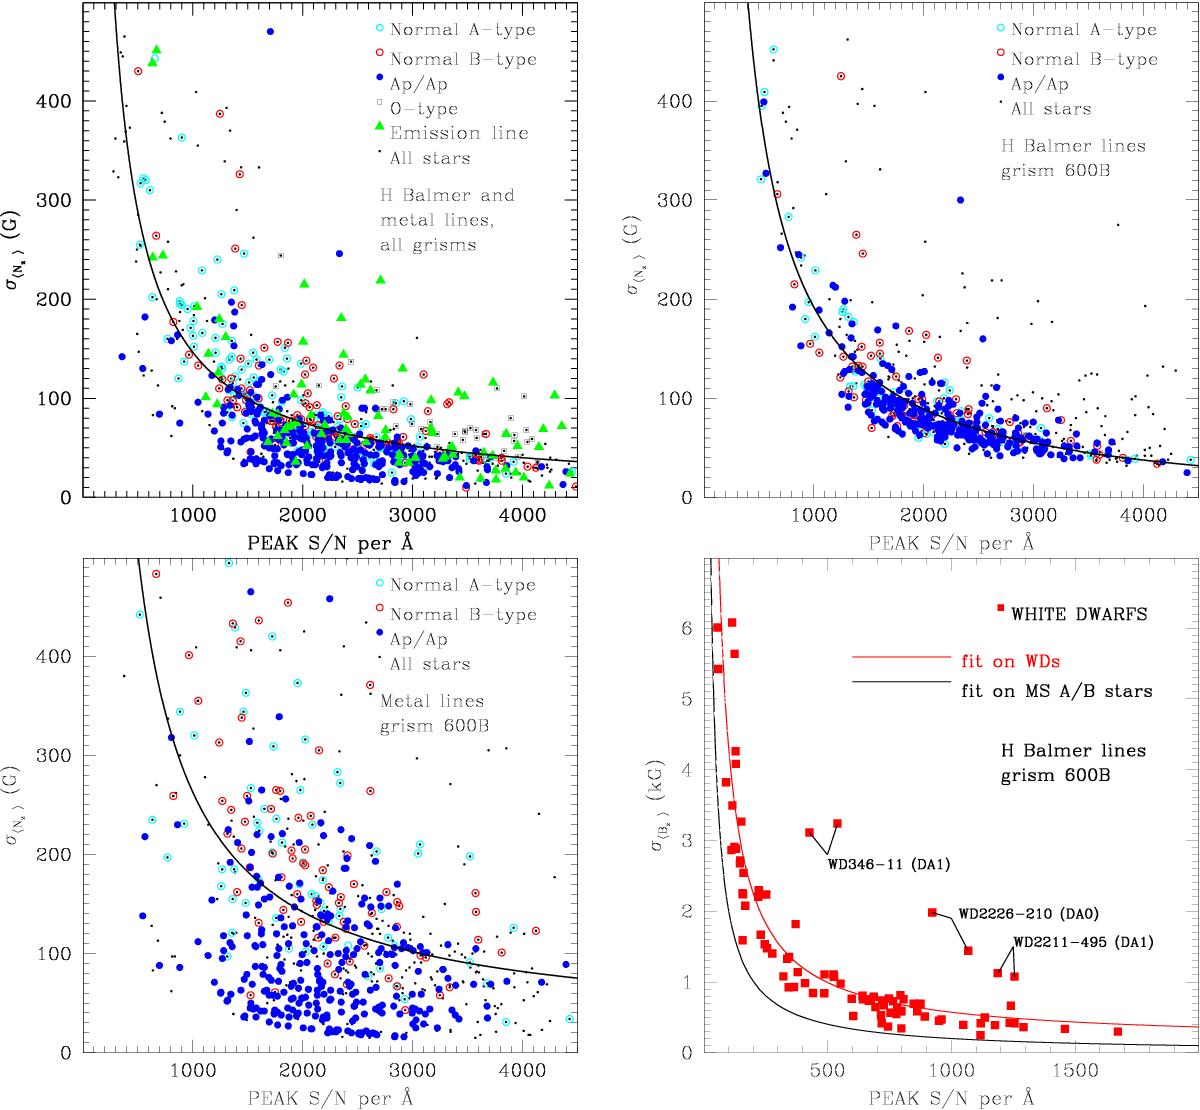
Error bars versus the peak S/N for different kinds of stars. Left top panel: the error bars on the null field for all stars calculated using both H Balmer and metal lines. Right top panel: same as left panel, but considering only main sequence A- and B-type stars (including Ap/Ap stars) observed using grism 600B, and using H Balmer lines only. Left bottom panel: same as right top panel, but using metal lines only. Right bottom panel: the errors σ⟨ Bz ⟩ on the longitudinal field measured from H Balmer lines only in white dwarfs; the outliers are the hottest stars.
Current usage metrics show cumulative count of Article Views (full-text article views including HTML views, PDF and ePub downloads, according to the available data) and Abstracts Views on Vision4Press platform.
Data correspond to usage on the plateform after 2015. The current usage metrics is available 48-96 hours after online publication and is updated daily on week days.
Initial download of the metrics may take a while.